Too Thin to Win
Although I’m a big proponent of trading with the use of chart patterns, a stock’s volume simply cannot be ignored.
I run across literally thousands of stocks every day in search of not only the best technical setups, but also the proper conditions under which to trade those stocks. I ultimately locate the cream of the crop for subscribers of my stock newsletter, and it results in consistently profitable trading.
There are many stocks which come through the scans with “the right look” to them, but a closer examination reveals some glaring reasons to avoid the stock as a potential trade. The most common reason pertains to volume, and particularly the risks associated with low volume.
Volume is the total number of shares traded for a given timeframe. It is a measure of liquidity for a stock, because it represents participation. High volume makes for a more competitive market with narrower spreads and more consistent price action. Low volume, however, is a warning sign to move on to the next trading idea.
Low volume stocks should not be trusted for several reasons:
Low volume means low participation. If very few people are active in a stock, then what appeal does the stock have? If participation remains low, that stock may simply sit idle while you have your cash parked in it, leaving you with fewer opportunities for profits.
Additionally, a stock with very low volume will often trade with a wide spread, which increases slippage when entering and exiting trades. Trading is hard enough without handicapping yourself with more difficult executions!
It is also far more difficult to accurately read the price action in a stock which might only trade every 10 to 15 minutes during the day. When a stock only trades 25,000 shares a day, what defines a big seller? 2000 shares? What defines momentum? A 20-cent move? It isn’t worth it.
And finally, a low-volume stock can be awfully hard to get out of if the tide turns against you and you need to get out. When the music stops and you need a chair, it’s going to be extremely competitive to get a good price when you go to sell your stock, which makes your losing trade even worse.
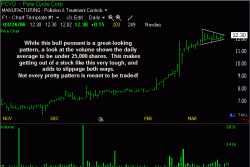
Let’s look at an example. PCYO showed up this weekend on my scans as having “the right look” to it. However, one glance at volume was all it took to see that this stock is too thinly traded for my liking. This stock averages fewer than 25,000 shares a day, which is entirely too light no matter how good the pattern might be.
PCYO has a very nice bullish consolidation which can easily be seen with the converging trend lines on the chart shown above, but this stock has hardly anyone trading it! This stock may take off and run higher, but the risk associated with the low volume of this stock tells me I would be far better off finding something else to trade.
When you screen for chart patterns, be sure to include volume in your requirements for potential trades. Just because the chart looks pretty doesn’t mean that stock should be traded. With literally thousands of stocks out there to trade, be strict with your criteria and put the odds in your favor every chance you get. Or, become a member at TheStockBandit.com and let us do the work for you!
Jeff White
President, The Stock Bandit, Inc.
www.TheStockBandit.com


