Technical Grade: F
Every chart should be given a grade, if for no other reason than it’ll require you to evaluate the entire situation and make a decision. Should it be traded? Should it be watched? Should it be avoided?
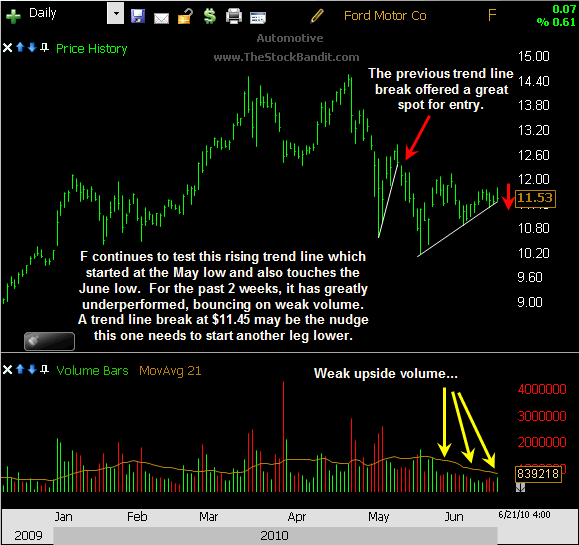
Looking at the chart of F below, this one earns an ‘F’ on recent behavior as well. Here are several reasons why:
- Lower highs are still in place. This one has been trending lower since the April high, with every bounce getting sold.
- For the past 2 weeks, the broad market’s bounce from the June lows has been far more impressive than the rebound in F.
- Volume on the recent bounce has been lackluster to say the least, with upside volume continuing to diminish. That shows very little participation on the buy side.
I’m watching F for a trade on the short side, and there’s a well-defined rising trend line that I’ll be using as my pivot. The last rising trend line was broken with a sharp move lower, and while this trend line isn’t quite as steep, I still like the potential for a new leg down starting if it gets broken at $11.45…and particularly if it happens on increased downside volume.
F could instead rally from here, in which case I’d simply avoid it. This one looks relatively weak, and the confluence of poor technical conditions lands it on my radar as a short candidate.
Here’s a closer look for you:

Trade Like a Bandit!
Jeff White
Swing Trading & Day Trading Service
www.TheStockBandit.com
Are you following me on Twitter yet?


peder | Jun 22, 2010 | Reply
You are forgetting the fundamentals regarding Ford. Sure short term it may be a short, but I’m expecting this bad boy to go back up to 15 by March.
TheStockBandit | Jun 22, 2010 | Reply
Hi Peder,
Not forgetting the fundamentals, just ignoring them. All I care about is the price action. A March timeframe is an ‘investment’ and I’m a trader, so yes, I’m short-term and looking at this over the coming days and weeks. I think it heads lower if the trend line breaks.
Ted | Jun 22, 2010 | Reply
SO price action as of today suggests a short? Its below the trendline but not really moving downside with any real volume.
TheStockBandit | Jun 22, 2010 | Reply
That’s how I see it Ted, the trend line is broken and I view it now as the path of least resistance being down. Today’s close will be the real tell, but it looks vulnerable now that rising support has been taken out.
TheStockBandit | Jun 29, 2010 | Reply
Taking profits on this short into today’s gap lower ($10.20) for the quick 11% in a week – hope you caught this one with me.