 Archive for September, 2010
Video Review of the Indexes 9-6-2010
September 6, 2010 at 12:41 pm
Last week proved pivotal as potential higher lows were established for the major indexes. Tests of key support brought out the bulls, who seized an opportunity to make their mark.
We’re now right back to resistance zones after a big 3-day run, and that could spell some short-term rest (if the bulls are lucky). Once they take a breather, however, the buyers just might floor it again with their sights set on the August highs.
As we head into a brand new week of trading, let’s examine some important levels to keep an eye on in the days ahead. That will have the greatest influence on how individual stocks are going to move, so it’s where the trading week begins.
This clip was also posted over on the Trading Videos site (as always), and perhaps you’ve seen it there – but in case you didn’t, I wanted to put it here on the blog for you.
Let me suggest going full-screen for best quality in the video.
Trade Like a Bandit!
Jeff White
Producer of The Bandit Broadcast
Are you following me on Twitter yet?
Why I’m Buying Financial Sector ETF’s
September 1, 2010 at 9:13 am
Financial stocks have been hideous. Banks, brokers, you name it and it’s been taking it on the chin lately. Shorts are getting cocky.
What’s so interesting though is that, like the market, many of these stocks have a shot at establishing a higher low on their daily charts relative to the July low – if this pullback finds buyers.
 I should clarify, I was once told that “IF” is a really big word for only 2 letters. That’s true, but let’s look at the financial sector ETF’s, starting with XLF.
By the way, the points stated below also apply to FAS and UYG, which I’ll review as well.
As a technician, I realize perfection isn’t to be expected when looking at a chart. Algorithms and savvy traders alike recognize that the head fake breakout or breakdown can be a fabulous way to establish reversal positions. And this is one such candidate.
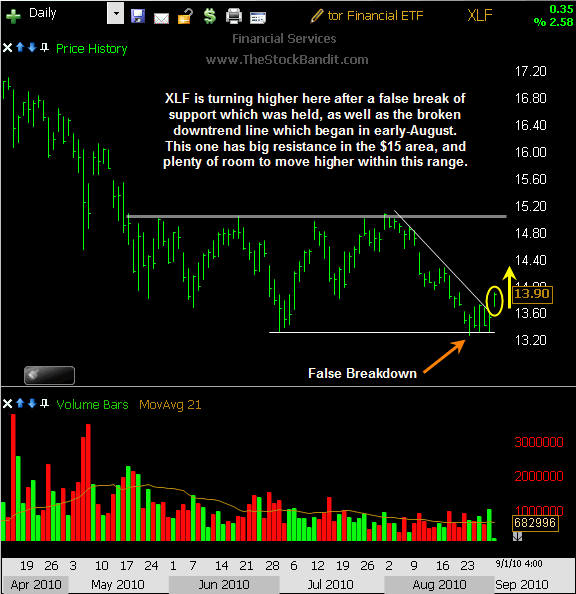
With the July 1st low of $13.34 getting broken by a nickel just last week, XLF has stabilized (for now anyway). I like that for a few reasons…
- First, it shook out some traders on that ‘breakdown’ through support.
- Second, it’s frustrating those who got short on the break, providing no follow through yet.
- Third, there’s a downtrend line just overhead which was established throughout August, which if crossed, would provide another technical reason for buyers to enter (or re-enter) the picture.
That leaves 3 potential trader types as would-be buyers if an advance begins…
- Shorts would need to cover.
- Shaken-out longs would want to re-enter.
- New longs would want to establish positions.
So there is some appeal here, on both technical and psychological grounds. Well-defined pivots like this from key zones can produce explosive moves – particularly when multiple groups of traders may be poorly positioned.
The Plan
With XLF churning over 70 million shares on an average day, this thing is not a fast mover. Plus, it’s range-bound with the $15 zone offering formidable resistance over the past 3+ months.
I’m establishing a long position at current levels with an initial stop stop in the $13.20 area (1/2 position beneath last week’s low), and a final stop just beneath the $13 level. That would be favorably offset with a potential move back up to the $15 neighborhood where key resistance resides.
The aforementioned $13 zone offered a multi-month peak back in May of 2009, and there’s an unfilled breakaway gap from August 2009 which could get filled on a continued slide from here. So, I view that as an adequate loss-cut area for this trade.
If this thing is able to gather some traction, I’ll then lighten and tighten (peel off pieces on the way up and adjust my stop accordingly). I’m expecting to be in it for a few weeks if it works, so I’ll be patient along the way.
Here’s a closer look at the XLF chart for you:

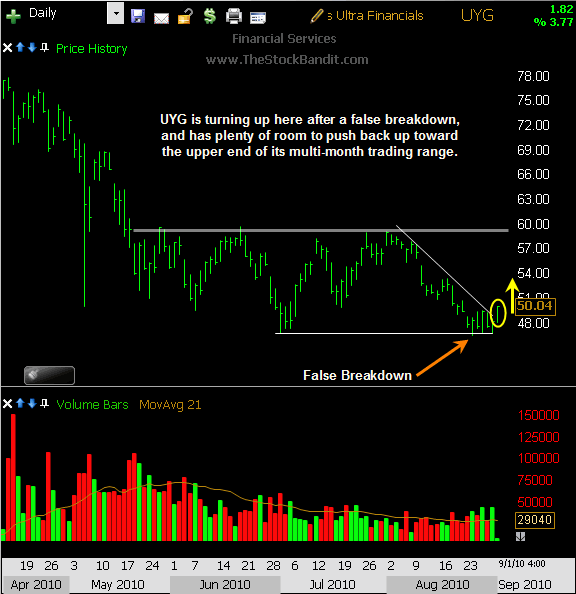
Not to be forgotten are the leveraged ETF’s, which offer more bang for the buck. UYG is the Proshares Financial ETF, which is essentially the 2x levered version of XLF. Using the same rationale, I’m looking for UYG to return to the $58.50 resistance area while using a stop of $46 should support happen to get broken solidly.
Here’s a closer look at the UYG chart for you:

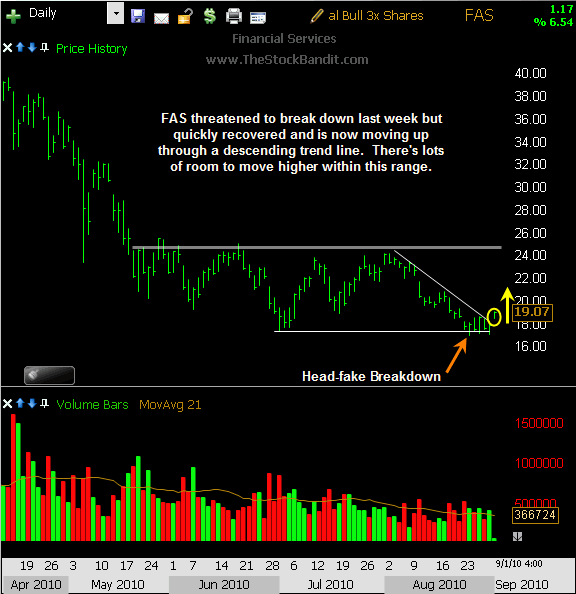
Finally, the title of “most slippery” of the levered financial sector ETF’s goes to FAS, which is the Direxion Financial Bull, which is 3x the movement you’d expect to see in XLF. Like the other charts, I’m looking for FAS to return to resistance, which is in the $24 area. Should it happen to break down, a gap fill from August 2009 down to the $16.50 area would be my cue to exit.
Here’s a closer look at the FAS chart for you:

Trade Like a Bandit!
Jeff White
Producer of The Bandit Broadcast
Are you following me on Twitter yet?


