Strong Coffee
Truth be told, a Slurpee is the beverage that’s actually on my mind (happy birthday 7-Eleven), but if you’re looking at the charts of anything drinkable right now, it’s all about coffee.
Granted, it doesn’t quite have the same ring to it as the 1999 Bubble or the Crash of 1929 (or ’87), but the Great Coffee Rally of 2011 is on.
Names like CBOU, JVA, PEET, GMCR and SBUX have been ramping in recent weeks, putting them squarely on the radar of momentum players far and wide. This isn’t your typical grind (no pun intended) higher. These things are hotter than a car hood in the Texas summer.
Like quite a few other stocks, most of these could certainly stand to put in some rest here in the short term, but once that’s done, these are among the strongest (no pun intended) stocks in the market. Let’s take a closer look at each one.
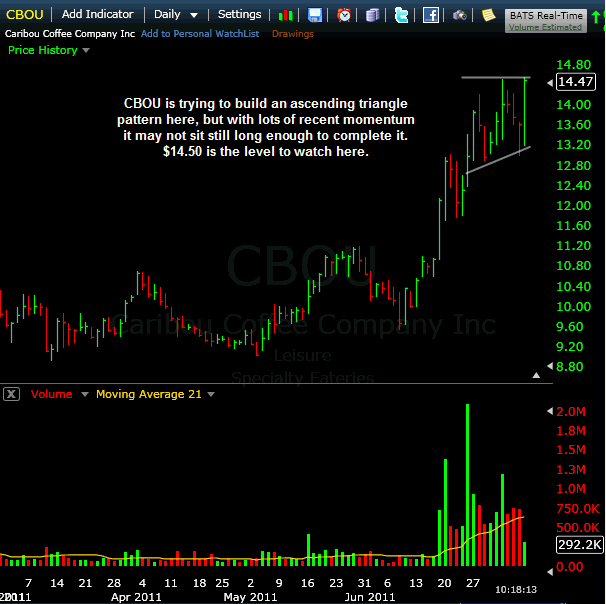
CBOU – Nice pick up in not only activity, but of course in price as well since the higher low was established in early-June. Next levels are $14.30 then $14.50 to set this one free for higher prices.
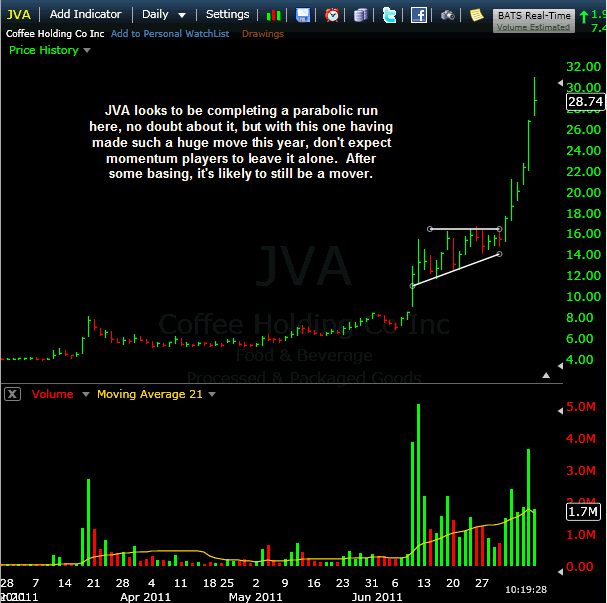
JVA – The July run alone has been more like a quintuple shot of espresso than your average cup of coffee. We’ve also seen a 323% gain since June 6th – how’s that for a wake-up? Incredible short squeeze action here and way too extended at the moment to consider an entry, but certainly deserves a spot on the watch list for one of these days when it has settled down and created a new pattern.
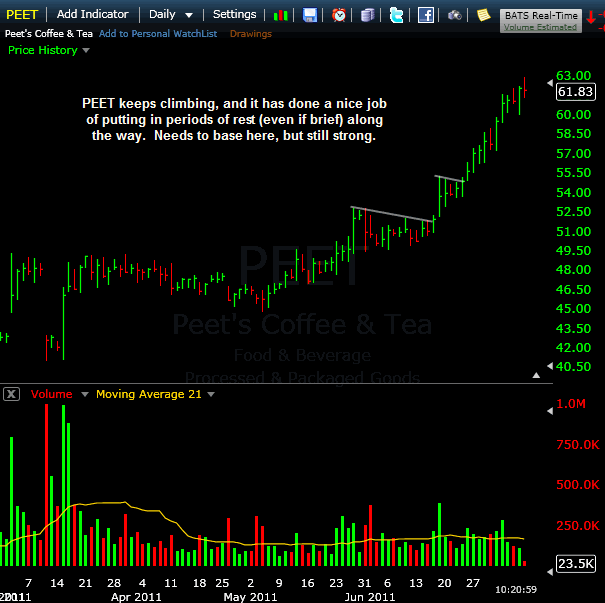
PEET – More of a steady grinder, this one has actually built a couple of bases along the way up. It’s not in a place where I’d be getting long, but once it puts in some rest, it’s certainly one to revisit. Lighter volume than the others.
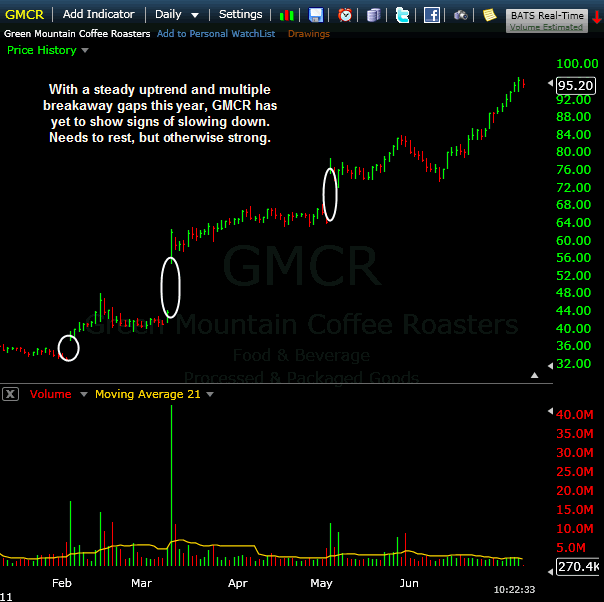
GMCR – At $95 per share, it’s a little rich (no pun intended) for some, but the uptrend is steady and this one continues to run. This year alone, we’ve seen 3 breakaway gaps which never saw attempts to get filled, serving as reminders that this one is very strong.
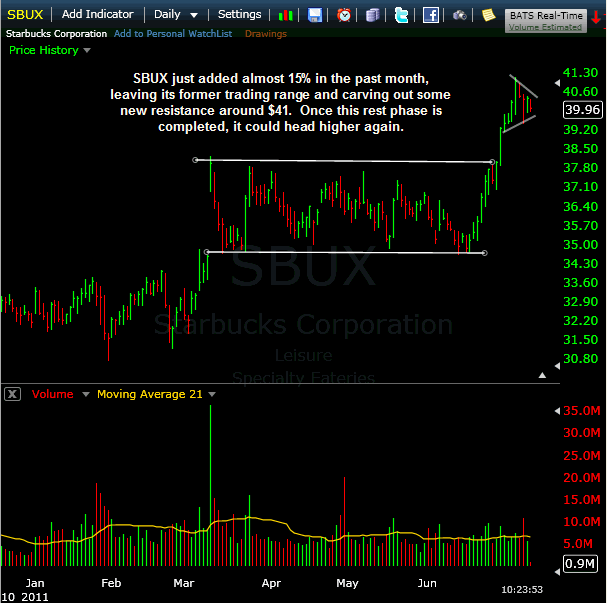
SBUX – The grandfather of them all might be kinda old, but he’s still got it! SBUX left a multi-month channel with a solid push higher a few weeks ago, tacking on nearly 15% over the past month. Currently it’s trying to put in a little rest, which is healthy to see. Once that’s done, don’t be surprised if another leg higher begins.
Trade Like a Bandit!
Jeff White
Producer of The Bandit Broadcast




Ted | Jul 12, 2011 | Reply
Jeff, just wanted to get your take on this sector since yesterday. We’ve seen some pretty large moves down. Would you be looking for a reentry or leave alone for now. I was looking at CBOU among others.
Pete | Jul 16, 2011 | Reply
Jeff, newbie here. First I want to thank you for all of your superb Worden Webinars. We are on the same page of keeping the chart clean and uncluttered, allowing for concentration on price, volume, pattern. I’ve noticed that you always or mostly use arithmetic grid line scaling, whereas most every pro trader I’ve studied down through the years uses logarithmic which I also prefer. Can you answer why arithmetic since it gives a skewed historical perspective to percentage moves when eyeballing a chart? Thanks.
Pete
TheStockBandit | Jul 17, 2011 | Reply
Hey Pete,
Thanks for this question, it’s a good one and one I should address more completely than just via a comment response. More on that later.
To answer your question, logarithmic charts are best for longer-term charts since they put percentage moves in perspective. Arithmetic make the charts display in equal point moves, so I find them better for short-term charts. Because I’m a short-term trader and rarely view the real long-term charts, I stick with arithmetic charts. The timeframe I typically view on the daily charts is about the past 4-6 months. Logarithmic charts are really good for traders who like to view the weekly charts, for example. Personally though, I’m looking for trades to play out over the next few hours up to the next couple of weeks, so the arithmetic charts and the shorter-term perspective they provide me with is just what I need.
I’m glad you’ve enjoyed the Worden webinars too, they are fun to do. I love sharing charts and discussing the market and fielding questions like that on the fly. For those who have missed recent webinars, here are two separate archives you can view and learn from even though they are from previous dates…will give you a good idea of how I view the charts and the ‘uncluttered’ type of charts I use each day.
Stop by again soon Pete, hope this helps, and go get ’em this week!