Trading Roadblocks
 Few things are as frustrating in trading as seeing a position start to take off, only to stop or reverse. When a trade hits the proverbial wall, it stops moving according to plan and quickly becomes dead money.
Nevermind the fact that you were long in the midst of an uptrend in the stock, and in a generally strong market environment. It’s time to bail out.
What if you had seen it coming?
Looking a little farther to the left on the chart can at times enable you to do just that. Sometimes we just get so fixated on the here-and-now pattern that we fail to recognize what might lie beyond. Overhead resistance looms like a roadblock, but without zooming out on the chart, you may never see it until it’s too late.
Due Diligence
As a short-term trader, I’m all about the recent price action. I care a great deal about how a stock has moved over the past 2-3 weeks, and every day of late. I’m gauging the volume, I’m looking for clean patterns, I’m designating my trading timeframe, and from there I’m able to project where the stock can go next if those patterns are confirmed.
But I don’t stop there.
Once I’ve identified a pattern, and made the corresponding game plan, my work isn’t finished. I still need to look at the bigger picture and take note of anything that might stand in the way of this stock running further. And I’m not referring to news which might break (although that’s particularly important during earnings season). What I’m referring to is potential resistance which the stock may have to contend with shortly after confirming the short-term pattern.
Exhibit A
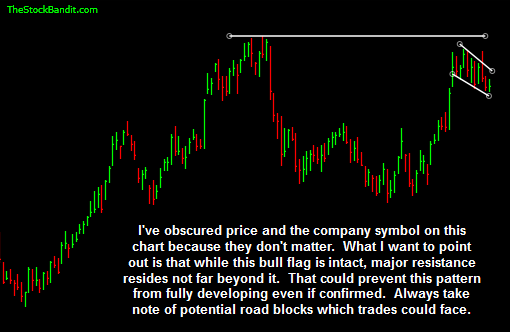
For example, I recently discovered a bull flag pattern. I can project, based upon the pattern, where the stock could head to next if that pattern gets confirmed. However, a look at the bigger picture showed me a glaring issue with the trade: it didn’t have far to run before the next resistance would be encountered.
That congestion zone from a few months back was a major potential roadblock for the play. Although the short-term pattern could confirm, the stock may still not get through the next resistance zone. So, this is the kind of setup I’d only consider for a day trade rather than a swing trade, because the risk I’d incur for a swing isn’t in proper relation to the limited profit I’d make if resistance holds.
Here’s a look at the stock I’ve been discussing. I’ve erased the company name and ticker symbol, because it doesn’t matter. Rather, this is an example of how I evaluate potential plays.

A month from now, this flag may have confirmed and the stock might blow through prior resistance as if it were never there, but that’s not for me to decide. My job is to evaluate risk, and only put my money at risk when the potential for reward outweighs that risk by a considerable amount.
Taking note of potential roadblocks like this is one way I can ensure my risk/reward on each trade remains suitable. Occasionally I might regret not taking the play, but over the long haul, I’m preserving my capital for far better opportunities.
Trade Like a Bandit!
Jeff White
Producer of The Bandit Broadcast
Follow TheStockBandit on Twitter or get our free newsletter to keep up!


