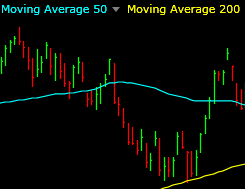
Questioning the 50-day & 200-day MA’s
 My recent post on Indicatoritis discussed how some traders rely on indicators incorrectly.
I believe that still holds true, but I was questioned about some common moving averages on the heels of that post.
So in this video, I want to discuss moving averages, and more specifically, two moving averages which are commonly accepted by traders as important: the 50-day and the 200-day moving averages.
We’ll look at some big-name stocks and let the charts speak for themselves on whether it’s appropriate or not to leave these MA’s on the chart all the time.
Be sure to view in HD (720P) and full-screen mode for best quality in the video.
Trade Like a Bandit!
Jeff White
Producer of The Bandit Broadcast
Follow TheStockBandit on Twitter or get our free newsletter to keep up!


Dantrader | Oct 25, 2011 | Reply
Thanks for the good insight on the 50 and 200 averages, what is your recommendation of stock charting software like the one used in this video?
Dantrader | Oct 25, 2011 | Reply
Thanks for the good insight on the 50 and 200 averages, what is your recommendation of stock charting software like the one used in this video?
Anonymous | Oct 25, 2011 | Reply
Thanks Dan, here is a link to the charting software I use, and it has a trial available. I’ve used it since the 90’s, love it.
Mark | Oct 25, 2011 | Reply
Thanks for making life simpler. Do you find the 30 day moving average more often useful? I’m just starting out, reading and learning as much as I can, and my charts (until I change my mind again) have the Bollinger bands which I think come with the 30 day moving average and that doesn’t seem to clutter things up too much. I had already impatiently dispensed with the 50 day and 200 day moving averages. I’m still not sure how useful a trailing indicator can be at predicting.
Anonymous | Oct 26, 2011 | Reply
Hey Mark! What I’m saying here is there is no magic # for which moving average to use. First you have to determine if a trend is present, then apply a moving average and fiddle with the value (200, 50, 30, 12, whatever it may be) and see what the stock has been respecting. It will likely be different for each stock.
As you noted though, it’s a trailing indicator, so it shouldn’t be used as a predictor, but rather as confirmation to what price is already telling you.
Make sense?
Mark | Oct 26, 2011 | Reply
Yes, that does make sense. I had just finished putting them all back on again (30, 40 and 50), but faded, and in the background, before I read that. Thank you.
Anonymous | Oct 26, 2011 | Reply
“faded, and in the background…”
I like that . Or just having them applied but not visible until they’re needed.
Ed | Nov 8, 2011 | Reply
Jeff,
I have watched a lot of investing video’s in my days. This is, without a doubt, one of the best I have ever seen. Excellent Job!
Regards,
Ed.
Anonymous | Nov 8, 2011 | Reply
Thank you Ed, lots more for members (nightly) & students (trading courses), but will be sure to keep the good free stuff coming as well. I appreciate you watching and thanks also for the feedback!