 Archive for August, 2012
TRIP Ready to Stumble
August 31, 2012 at 3:09 pm
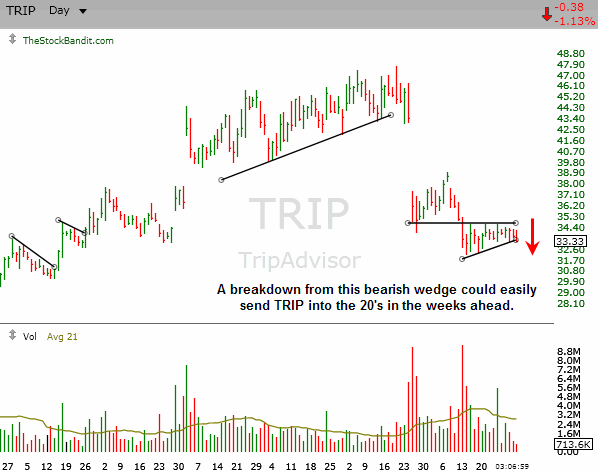
TRIP saw a big negative change of character in late July with a big downside gap on heavy volume. The initial recovery attempt fell right on its face with the creation of new correction lows just three weeks later, highlighting the importance of avoiding the long side after a trend shift.
Currently, the stock is wedging beneath former support after bounce attempts in the past two weeks have proven unable to reclaim the $34.75 area. The rebound is looking stalled-out, and now price is beginning to weaken. A break of the lower rising trend line of this wedge would occur around $33.10 to be sure, and would likely usher in lower prices in the coming weeks.
Here’s a closer look at the chart of TRIP for you:
Trade Like a Bandit!
Jeff White
Subscribe to our Stock Pick Service to get our trades.
Wait to Place Bets on LVS & WYNN
August 30, 2012 at 11:28 am
Casino stocks have seen a marked improvement in their price action over the past month. A couple of them looked like death, but alas, they have perked back up and shifted their path of least resistance.
Two names in particular are LVS and WYNN, both of which have seen very constructive price action in recent weeks with upside momentum as well as rest phases – a very bullish combination.
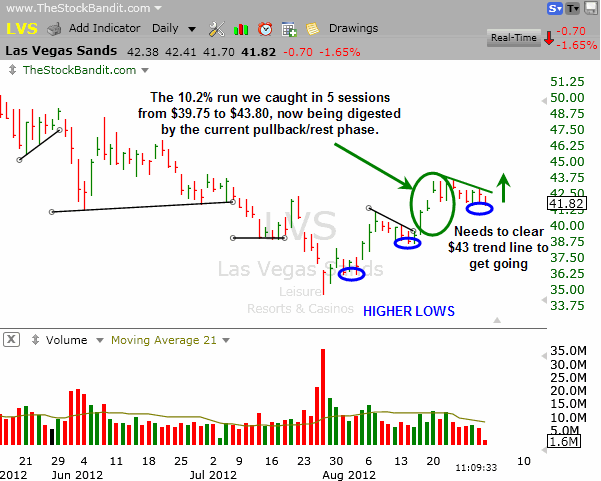
I caught an excellent swing trade in LVS (which I shared with members) on Aug. 16 as the stock pushed past a descending trend line at $39.75 to begin another leg higher. That was worth a quick $4.05 to us as just 5 sessions later it hit Target 2 at $43.80, proving to be a timely exit.
Since then, it has given up a couple of points with some mild profit taking, but remains overall bullish. The stock may need a bit more time before it’s ready to rise again, but it belongs on the radar. The next move may not be quite as smooth, but a longer-term trend change looks to be in the making with a considerable cushion in place between current prices and the July low.
Here’s a closer look at the chart of LVS for you and the levels to keep an eye on:
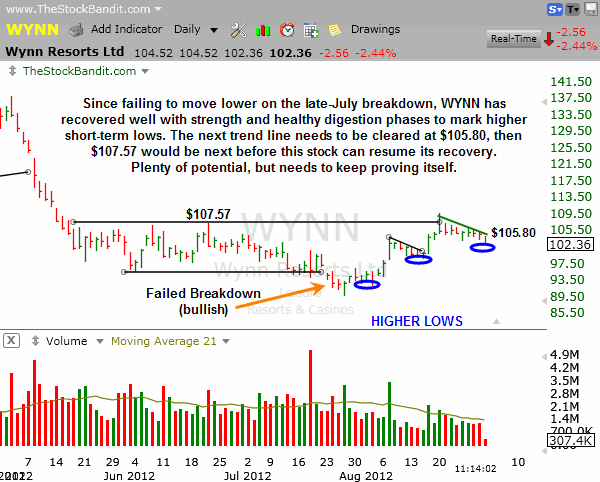
Another name in the same group is WYNN, which has seen a similar shift of character in recent weeks. Following a breakdown from the May-July trading range, the stock worked its way back into the range and early last week pushed past the upper boundary to create a higher high.
Since then, we’ve seen a quiet retreat but no negative character change as of yet. The current pullback could quite feasibly result in another short-term higher low (vs. $99.09 on 8/15), keeping the 4-week uptrend intact. Next it would need to close above the June high ($107.57) to confirm an exit from the channel, and then it’s got ample room to run higher to retrace the May selloff.
Here’s a closer look at the chart of WYNN for you and the levels to keep an eye on:
Each of these are showing signs of life again after harsh corrections from their spring highs, but may need a bit more time before they’re set to go. Keep them on the radar.
Trade Like a Bandit!
Jeff White
Subscribe to our Stock Pick Service to get our trades.
Under Armour Over Achieving
August 29, 2012 at 11:21 am
Relative strength is always applicable when comparing a stock with the overall market, or with its competitors.
In the case of UA, we’ve seen clear outperformance and plenty of relative strength compared to its senior rival, NKE. Since the beginning of the year, UA has tacked on 61%, while NKE has added a measly 2%.
Here’s a comparison chart of UA vs. NKE for 2012:
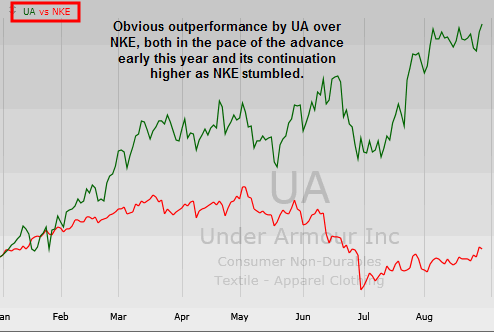
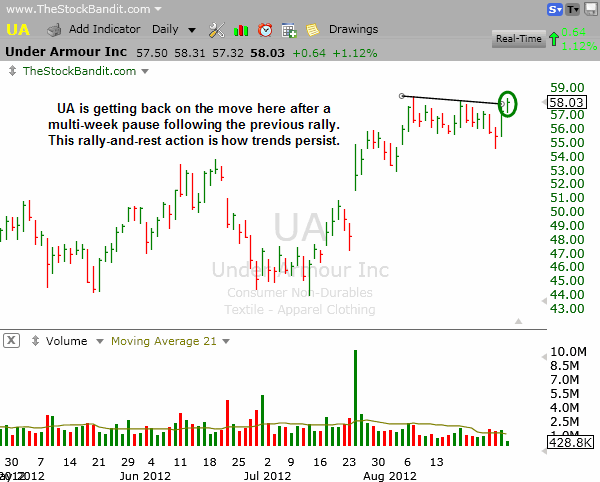
While UA has had an already impressive year, it has come with a few bumps in the road and the occasional swift pullback. However, overall the chart looks excellent on the year with an early rally, a mid-year trading range, and some continuation higher since late June. Today it’s clearing a short-term trend line from the past few weeks as it challenges the 52-week high. Needless to say, it looks poised to add to its YTD gains.
Here’s a closer look at the chart of UA for you:
Trade Like a Bandit!
Jeff White
Subscribe to our Stock Pick Service to get our trades.
Confirmed Trend Change for VZ
August 29, 2012 at 10:21 am
The double top pattern – like the double bottom pattern – is over-diagnosed. Anytime a stock challenges a previous high, the amateur technician jumps at the chance to declare a double top in the making. And generally they’re premature in doing so.
But the professional takes a different approach.
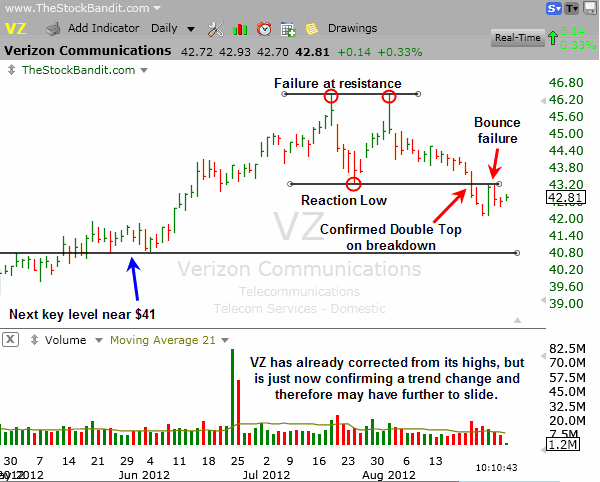
Rather than seeking to be the first to recognize a trend shift, it’s better to wait for confirmation of that change to come along. And in the case of the double top pattern, that requires a break of the reaction low or pullback low which was established between the peaks.
A stock fitting this description right now is VZ, which just confirmed not only a double top but has also offered an additional layer of importance by failing to reclaim former support on the bounce.
One other note is to take a look at the 2nd high on the chart on Aug 1. Price touched the previous high to the penny (not a requirement for a double top, by the way) and failed to clear it, but something else happened which was noteworthy: the finish for that day was much weaker than the day when it initially marked a high (July 18). This is another thing to watch for which might offer clues that a stock is perhaps running out of steam and deserves a closer look going forward in anticipation of a potential trend change.
Going forward for VZ, the path of least resistance is down, at least until the $43.40 area (lateral support/resistance) is reclaimed on a closing basis. That’s the level which can now be traded against. The stock looks to have next support around $41, which was a level of importance back in May.
Here’s a closer look at the chart of VZ for you:
Be careful jumping to conclusions about double tops or bottoms. Instead, be patient enough to wait for confirmation of a trend change so you can trade with greater confidence of the direction.
Trade Like a Bandit!
Jeff White
Subscribe to our Stock Pick Service to get our trades.
Trade Multiple Timeframes
August 23, 2012 at 11:42 am
This market has definitely favored the bulls since the June low. During that time, the S&P 500 has risen more than 11%, which isn’t bad at all in just 2 1/2 months. Every single dip has been bought, and those who have been stubborn enough to attempt to short sell pretty much anything for a timeframe longer than a quick scalp have faced a stiff headwind.
The market’s been strong – you just can’t deny it. The real money has been made on the long side, and there have been multiple timeframes which have been paying off nicely. We’ve seen days with bursts of strength for the intraday player, as well as multi-day and multi-week advances which have favored the swing trader.
This idea of trading across multiple timeframes is something I put a great deal of emphasis on, and lately that’s been one great way to diversify as a trader. That’s why it’s such a big element of what we teach.
Bread, Butter, and Gravy
The swing trades shared in our stock pick service are what we tend to focus on most – they’re our bread and butter. Generally, we hold them for a few days up to a couple of weeks. They provide larger moves but sometimes take a little more time to develop. We like to buy stocks coming out of defined chart patterns like bull flags or triangle patterns, and it works to our advantage.
For example, here are two setups which took a few days to make their moves, but which provided us with some quick profits.
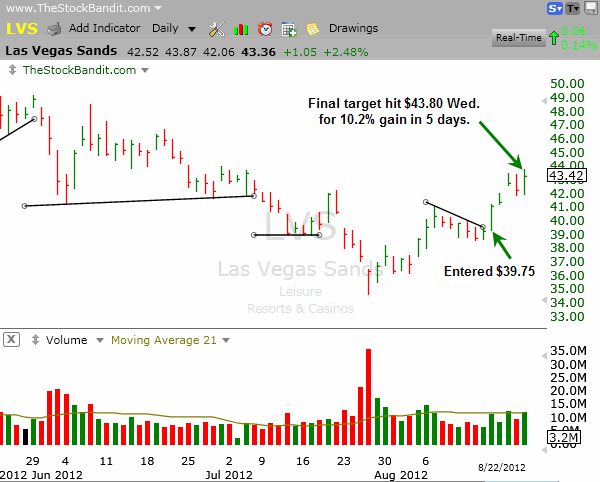
One is LVS, which we entered at $39.75 as it cleared the descending trend line on 8/16 to begin a new leg higher. 5 sessions later, we booked a 10.2% profit (Wednesday).
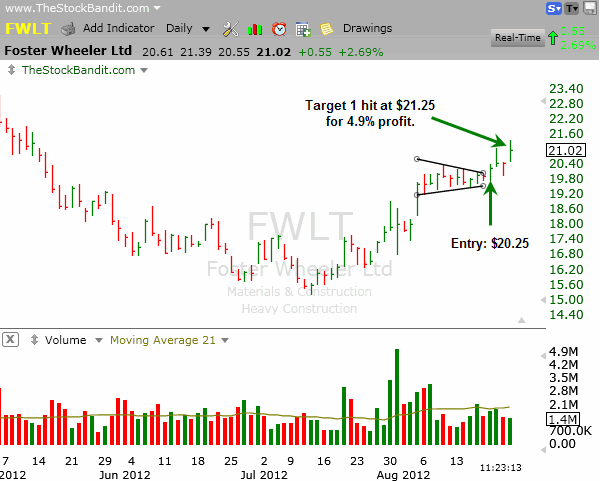
Another is FWLT, which is an open position which we’ve already booked partial profits in. A move up through $20.25 was our trigger price on Monday, and earlier today (just 3 days later) the stock hit Target 1 for a quick 4.9% profit, allowing us to lighten and tighten.
And yes, we take losses too! However, we keep them small and admit defeat quickly when the market proves we’re wrong. That’s the key to surviving as a trader.
Grabbing the quicker day trade types of moves also gives us added market exposure while we’re waiting for the swing trades to develop. The profits from these trades are the gravy. Some last only minutes, but they can add considerably to the bottom line. These candidates are also based on the daily charts, but we just look to grab the initial moves in them of 2-4% typically.
Trading multiple timeframes is a nice way to diversify with your trading, especially right now when the market keeps edging higher. If you know how to catch the initial move when a stock breaks out, you can build up some quick profits while your other trades work on a different timeframe.
There’s nothing better than having your money working for you in the short-term AND in the intermediate-term as a trader! Always seek to uncover more opportunities on multiple timeframes, they’re out there right now. Or pay us to find them for you.
Jeff White
Get our free newsletter to keep up!
Up 10 of 11, SPY Still Not Extended
August 20, 2012 at 9:24 am
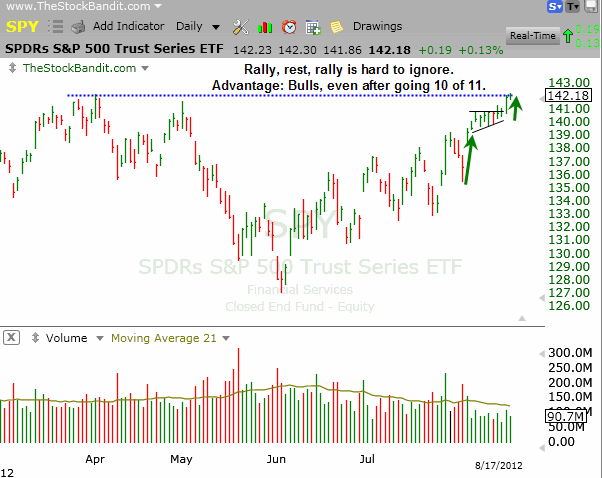
SPY has made a nice run since early August when a Monday-Thursday pullback was followed by a Friday lift which erased the 4-day slide. We’ve seen consistent follow through since then as well, sending the SPY into Monday having posted gains in 10 of the previous 11 sessions.
A run like that is never something to discount, and if blindly I heard a stat like that, I’d be highly cautious. But in this case, it hasn’t left the SPY extended. It’s up 4% during that time, but the way it has happened has been healthy. The early portion of the run was rapid, then we settled into a rest phase. That pause lasted 5 days, yet SPY only gained $0.46 during that stretch. There was even a decline of a whopping $0.07 (Aug. 13), which isn’t the kind of a reaction the bears can be proud of.
To see this major ETF posting so many advances of late would ordinarily be a bit scary. Technically though, it’s been a sharp rally, a healthy rest, and then some continuation. Why would that be something to fade?
We’re facing 52-week highs in the SPY and S&P 500, but they both still have room to run if the bulls feel so inclined. We may turn lower and this run proves to have been a great selling opportunity. However, the bulls have created higher lows on every single pullback since the June low, and that deserves respect. I’m not about to bet against them.
Here’s a closer look at the chart of SPY for you:
Trade Like a Bandit!
Jeff White
Producer of The Bandit Broadcast
Are you following me on Twitter yet?


