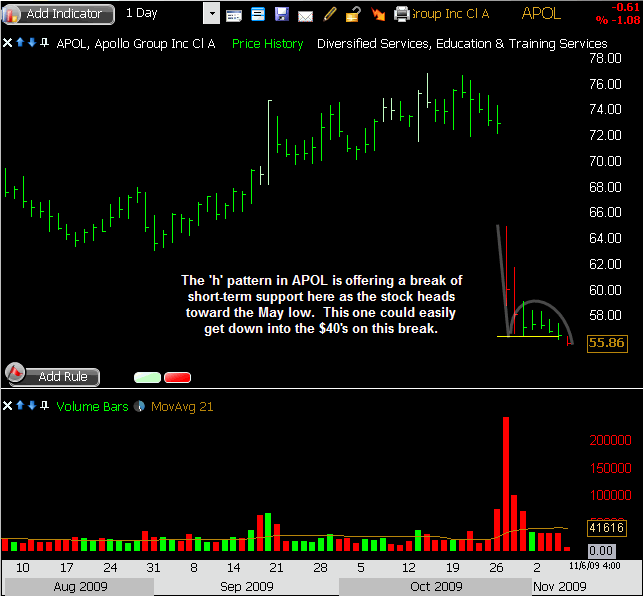
APOL Flirting with Breakdown from ‘h’ Pattern
Classic chart patterns still work quite well, and I trade them regularly, but they aren’t the only patterns out there to watch for.
One pattern I’ve taken notice of in recent months is the ‘h’ pattern. This happens when a stock has a sudden or steep decline followed by a very quiet and weak bounce. The bounce begins to fail, and the price pattern resembles a lower-case h.
The way I trade the ‘h’ is to go short upon a break of the support level. It can offer an entry on the short side for a secondary move lower, and can carry a nice risk/reward profile with it.
APOL has this pattern right now and it’s starting to undercut support here. The stock has already been very weak since late-October, but it’s struggled to rebound. It bounced from the $55.35 level back in May, but below that the next stop could be in the $40’s.
Here’s one that’s worth a look.
Trade Like a Bandit!
Jeff White
Are you following me on Twitter yet?


Nat Robbins | Nov 7, 2009 | Reply
Jeff,
I have a tough time ignoring the oversold factor here (around 2 on the 14,3,3 stochastics). Where would you put your stop? And is there a way to measure your objective with the “h” formation? Thanks for the help. You and Charles Kirk are the best.
Nat
TheStockBandit | Nov 8, 2009 | Reply
Hey Nat,
Thank you very much for the kind words. Anytime I’m mentioned in the same company as Charles Kirk it’s an honor. He is a good friend and a class act.
As for APOL, yes it is a bit oversold, but it could remain that way. It has put in a rest since the initial selloff, and that rest looks to be getting resolved to the downside with Friday’s turn lower. That tells me it’s really struggling to bounce here at all, so until it clears the $57 area I still think the short-term path of least resistance is down.
The ‘h’ pattern is one I’ve only been trading for a few months, and I haven’t really come up with a universal projection for it yet. I would classify APOL as a unique situation given the big downside gap. With that said, I’d probably expect a measured move from the start of the 10/28 bar to the support level of the ‘h’, which is roughly $8. So a breakdown from $56 would take it down to the $48 area, which would correspond pretty well with a test of the 10/2008 low. A more conservative target would be above that low, but I still think it could easily undercut the $50.
Hope this helps, thank you again for your comments and for reading the blog – have a great week of trading!
Jeff
Kevinbantz | Mar 30, 2012 | Reply
APOL et al all behave the same way, I remember them from the 1990-1991 recession. Short economy long trade schools. Now long economy short trade schools.