Steep Trend Lines Beg to Be Crossed
This market is ugly – as in really hideous.
Fear & Panic aren’t really even the appropriate words at the moment for this price action. It’s more like sheer disgust.
Would-be buyers are trusting that they’ll see lower prices (almost by the day) to put their cash to work, so what’s the hurry? And at the same time, bears who will eventually cover aren’t having to tiptoe around – they’re strutting. Likewise, they sense no urgency for needing to exit short sales.
Such is the nature of a downtrend.
From the Mood to the Technicals
But as is often the case, there is a technical threat of a short-term reversal. And it isn’t based on the oversold indications which are quite prevalent right now. Simple is usually better in technical analysis, so in this post I’m just going to point to a couple of trend lines which are looking a bit too steep.
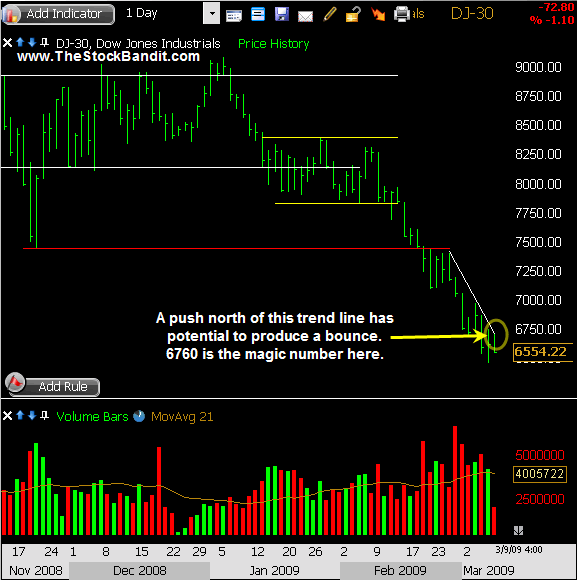
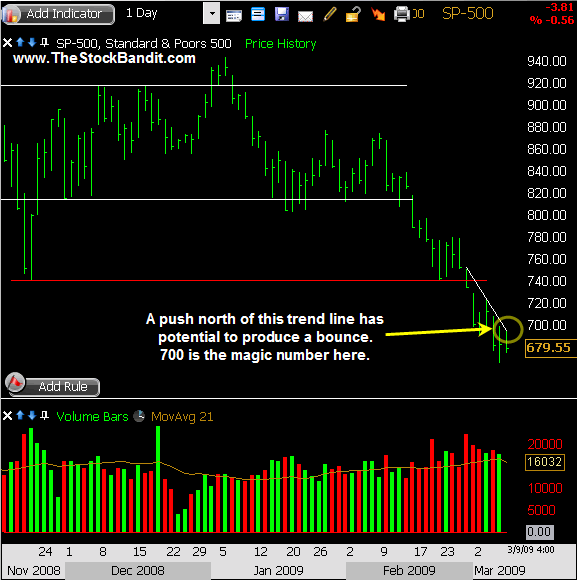
It’s important to note that the steeper a trend line tends to be, the more likely (and the sharper) a short-term reversal becomes. So this is no prediction, but watch for a cross of these trend lines in the coming days should it happen to occur. If it does, it just might produce a playable bounce. (Notice I said bounce.)
A Look at the Charts
Up first: the DJIA. Keep in mind this trend line is descending daily, so it changes daily. At the moment though, a push back above the 6760 area would clear it. Have a look:
StockFinder Chart courtesy of Worden
Next: the S&P 500. Here again, the trend line descends daily and therefore should be double-checked to determine its exact value. For now, a push back above the 700 level would produce an upside break and might result in a tradable bounce. Here’s the chart:
StockFinder Chart courtesy of Worden
I hope your trading week is a good one!
Jeff White
President, The Stock Bandit, Inc.
Swing Trading & Day Trading Service
www.TheStockBandit.com
[tags]Stock Market, Day Trading, Stock Trading, Investing, Swing Trading[/tags]


