 Author Archive for Jeff White
Jeff White is the founder of www.TheStockBandit.com, a nightly newsletter for active traders. He has been trading his own account for over a decade and currently trades full time in Texas.
Two Ranges to Watch
June 21, 2011 at 11:28 am
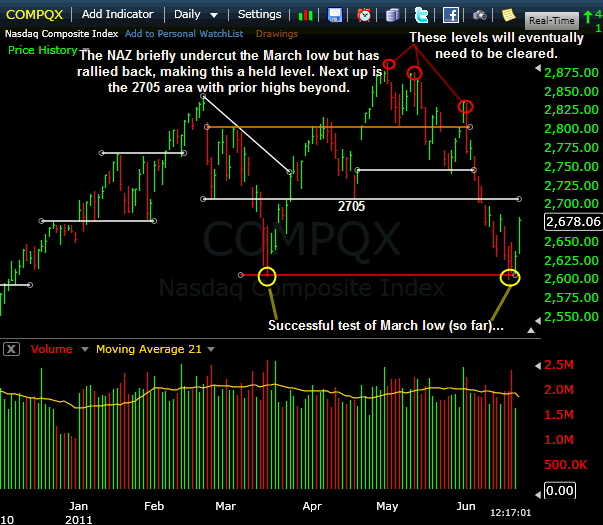
Last week we saw an important test of the March lows in the NAZ and RUT, while the S&P 500 held slightly above support from the spring. Those March lows give us a well-defined area to trade against, even if it’s a long way back up to the May highs. Stated otherwise, we may have just carved out the low end of a very wide range.
But that’s not the only range found in this market. We also have the NAZ caught between the 2700 area (late-Feb low & mid-April low) and the 2600 area. It’s working its way back up toward 2700, so the key will be if that level can be reclaimed on a closing basis.
Here’s a look at the NAZ, including both the wide and narrower ranges previously mentioned:
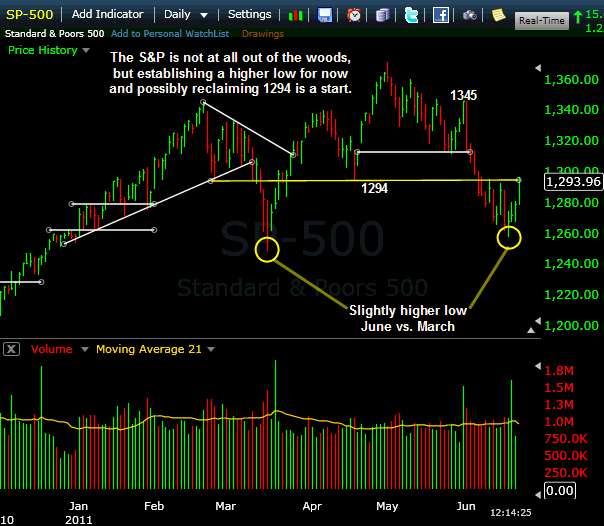
The S&P 500 has a slightly different situation here as it held above the March low and is currently flirting with the 1294 area which has proven important. We saw the late-Feb selloff end at that level, as well as the mid-April pullback finding support at 1294. More recently, that level was broken on June 6 and has yet to be reclaimed on a closing basis. A push back up through there could certainly help this index, although it still has plenty of rebuilding work to do. It has a higher intermediate-term low in place for now (June vs. March), but still stands a considerable distance from prior bounce levels (most notably 1345 from May 31).
Here’s a look at the S&P 500 chart along with the noteworthy levels right now:
Needless to say, this market remains interesting and there should be no shortage of movement going forward.
On another note, the premium newsletter turns 7 today, so for those of you who are members and have stuck around from the beginning in 2004, we appreciate you and remain committed to providing ongoing, exceptional value which adds to your trading process!
Trade Like a Bandit!
Jeff White
Producer of The Bandit Broadcast
Caught In A Trap
June 16, 2011 at 5:44 am
Anytime the market tanks like it has lately, astute traders realize that shorting after a decline of this magnitude and momentum is a real potential bear trap. A sharp rebound could come at any time, leaving late shorts in a world of hurt.
I can’t and won’t argue with that – in the short term.
But the further this market declines in the intermediate term, the growing group of trapped traders are the bulls. Keep in mind that the past few weeks have been a big shift of character for this market, with the prevailing mantra moving from buy-all-dips to sell-all-rallies. Technically, that’s very important to recognize.
And while a sizeable bounce will eventually arrive, the important issue for most bulls is “from what level?”
Head Games
That brings into play the psychological aspect of this change of character, whereby not only do bulls become fearful, but the bears gain confidence. Bulls who bought virtually anytime over the past few months are now underwater, and the deeper this correction goes, the more that late-to-the-rally-party group wants out.
That could quite easily play out with bulls selling on the way back up – just the opposite of a few weeks ago when trapped bears covered on every little dip. By the same token, just as a few weeks ago we were still seeing underinvested or aggressive bulls put more cash to work on even minor pullbacks, the deeper this correction goes, the more the bears will be using bounces to remount short positions. That means what used to be buying by both camps is quickly morphing into selling by both camps.
A spring back up will at some point arrive, so fear not – this market is still a 2-way street. But for now, respect for the tape should remain very high, because anything is still possible. Whenever the inevitable recoil of this selloff kicks in, keep in mind that it too could get faded, and therefore will have to earn your trust.
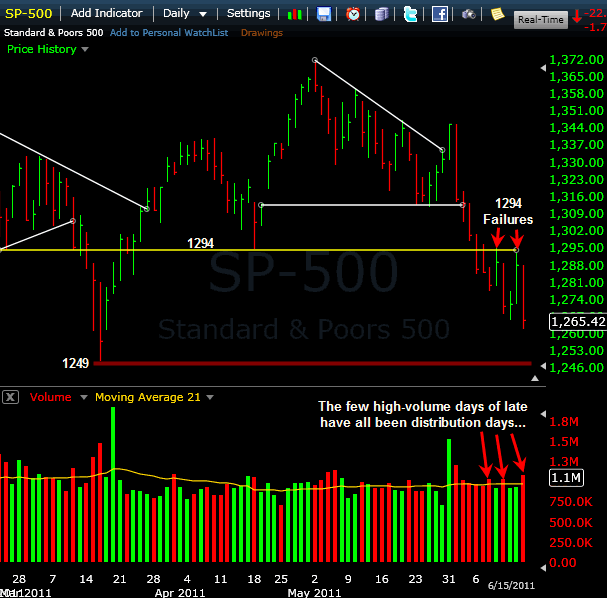
Here’s a look at the S&P right now with the March lows coming quickly into view at 1249 (which may need to get broken before a real bounce happens):
Trade Like a Bandit!
Jeff White
Producer of The Bandit Broadcast
YOUR Trading Plan, Part 3
June 15, 2011 at 7:52 am
 In Part 1 we discussed the importance of discovering YOU. In Part 2, we looked at the need for defining risk so that you know “the number” for every trade you make.
Here in Part 3, let’s see what the remaining process might look like.
Playing Favorites
In accordance with what you’ve already discovered about yourself, the first step in the next phase is to identify 3-5 patterns you’re comfortable trading. This chart pattern page is a great starting point. Pick out a few you think you can locate with ease, and you can always build or add more later. The aim is to master a few plays which you can rely on, and then build more into your arsenal later.
Next, set up some watch lists for each of those patterns. Add stocks into the appropriate list (ex: ascending triangle candidates) and remove them when they fail to meet the designated criteria. Filter out low-priced stocks or thinly traded issues (I prefer to avoid stocks with daily average volume below 500,000 shares). This is just another way to narrow down your list. Draw trend lines when necessary, and make notes when you see important technical events unfolding. My stock newsletter highlights actionable ideas with identifiable patterns nightly which you may be seeking. But regardless of where you get ideas, the point here is to cultivate them on an ongoing basis.
At this point, it’s time to eliminate stocks which misbehave. These are stocks which gap frequently, or which tend to make sudden, adverse moves, or which have a history of breakout failures immediately after clearing resistance levels. Some stocks my either be too volatile or too sluggish for your liking, so get rid of them. It’s up to you, but by studying your lists closely on a regular basis, you’ll identify certain “personalities” which seem to jive better with you than others, and again this will narrow down your list by eliminating those which are not a fit.
All About Priorities
Finally, designate a way to prioritize plays. It might be the pattern itself (maybe you like ___ pattern better than ___ pattern). Or maybe it’s a certain price range preference (ex: you might like stocks in their $30’s better than single-digit stocks). It may be based upon the cleanness of the pattern – for me this is important. I like cleaner patterns, just because they are that much more concise on when I should be IN vs. OUT of the trade.
Whatever you choose, have a hierarchy for which plays you seem to do better with than others, as this will help you narrow down *your* trades without putting you into the first 25 stocks you see. It’ll also help you decide which plays to hold onto and which plays to rotate out of when you see a more fitting opportunity for your capital.
CONSISTENCY is the key. The actual selection you make isn’t nearly as crucial as many think. It’s more important to be decisive and pick one and manage it properly than it is to flip/flop between one strategy and another. The success comes in having a plan and putting it to work over and over through time, like a batter knowing he’ll have 1000 at-bats. You want to eliminate errors, and those largely come from indecision and inconsistency, like swinging at pitches outside of your hitting zone.
I hope this series has been helpful to you and has answered some lingering questions which pertain to your unique situation. There IS a trading style for you, but you have to ask the right questions, put the right kinds of plays into your routine, and then consistently execute the plan you’ve set forth.
Should you need additional coaching or assistance for your trading, contact me and I’ll be glad to show you several solutions.
Trade Like a Bandit!
Jeff White
Producer of The Bandit Broadcast
YOUR Trading Plan, Part 2
June 14, 2011 at 9:36 am
 In Part 1, I put forth some questions that need to be answered by you in order to move forward with any lasting effect. Those help you identify what it is you’re after, what styles you should pursue, and which approaches you should completely avoid. Let’s proceed.
Start With the Basics
Understanding your preferences, biases, needs and availabilities will clarify your basic approach.
For example, if you were trading a retirement account (non-margin, and thus no short selling, and you prefer the long side and capturing segments of uptrends, you’ve got a starting point. You might narrow your focus to a long-only style based on patterns such as resistance breakouts, as well as bullish continuation patterns like bull flags, bull pennants, and ascending triangles. Those are easily identifiable patterns, which is nice, so you should have a steady flow of candidates to suit your needs.
See what I meant in Part 1 when I said trading allows you a custom-designed approach?
Go Big AND Go Home
Next, decide on a risk amount per trade, in terms of potential dollar loss – not in terms of cash outlay. Think in terms of “real risk” or what you’re truly risking before exiting on the downside. This is the amount you’re willing to lose if/when you are wrong.
That sounds negative, but it’s crucial. Whether it’s $200 or $500 or $5,000 doesn’t matter, so long as it’s a suitable amount of risk for your unique situation. The amount itself is of secondary importance to simply having an amount. It’s a starting point for every trade.
Too many traders fail to begin with an amount of risk they can stomach, and they trade too big and pay the price. That’s no good, so always aim to trade within your means so you can survive and make good decisions.
For example, let’s say your risk amount is $200 per trade. This is what you’re willing and able to risk (lose) if the play doesn’t work out.
So take a trade in XYZ with a pattern that suits you, like an ascending triangle pattern. A breakout might be at $18, and a failure might be at $16. So you could go long this hypothetical trade at $18 with a $16 stop. That’s a $2 per share stop, and you’ll risk $200 per trade, so you could buy 100 shares. Easy math. It doesn’t have to be complicated to be helpful to your trading.
See how knowing *the number* for you can help you understand how much to be trading? The strategy itself is based on the pattern confirmation (entry) or failure (stop loss), but your position size comes down to what you’ll risk per trade. Few traders incorporate this into their plan, but if they did, they’d be miles ahead and avoid many painful trading disasters as well.
In part 3, I’ll wrap this up with some specifics for your overall process. Until then, decide on some basics which suit you and figure out your ‘number.’
Trade Like a Bandit!
Jeff White
Producer of The Bandit Broadcast
YOUR Trading Plan, Part 1
June 13, 2011 at 12:42 pm
 You are unique (and you don’t need me to tell you that). The desire to find a trading plan that’s right for YOU is of paramount importance, because we are all a little different.
When it comes to your chosen trading methodology, you need to determine a number of things about yourself before going forward. These are things like your trading timeframe, risk tolerance, directional bias, and desired setups to pursue.
That’s the beauty of trading, you know. The market offers you the ability to custom-design an approach that works for YOU. Ask yourself questions such as…
* Will you be day trading for smaller but more frequent profits, or will you be entering positions for several days or weeks?
* Will you be comfortable keeping tight stops of just a few percent, or are you comfortable allowing more breathing room for trades in order to reach a more distant profit objective?
* Are you comfortable short selling, or do you prefer to only buy stocks?
* Are there specific patterns which you really like to trade or have found success with, such as buying dips within uptrends or perhaps buying breakouts?
These kinds of questions which can only be answered by you, but you MUST determine those answers in order to be effective. Those answers are paramount to your finding the proper strategy for YOU. I cannot emphasize that enough. Otherwise, you’ll be chasing different strategies by the day, but never knowing what’s working best and what to completely avoid. And if you’re dabbling in strategies which don’t suit you, you will not trust them or commit to them.
So when it comes to your trading plan, the more clear you can be on who you are, the more clearly you can define what it is you should be trading – and (equally important) what you should NOT be trading. That last part gets many traders in trouble, they stray into unfamiliar territory and find themselves making poor decisions which prove costly.
Since this is Part 1, there’s obviously more to come. But before the next part arrives, you have some homework to do – answer those questions above. I don’t want to know the answers to them, but you’re going to need them. Otherwise, the info to follow will carry no significance to you, rendering your time (and mine) completely wasted. Don’t be “that guy!”
I’ll see you in Part 2.
Trade Like a Bandit!
Jeff White
Producer of The Bandit Broadcast
MON Day Trade Review
June 10, 2011 at 10:13 am
Lately I’ve not trusted the price action much when it comes to swing trading, and that’s largely a product of how this market has been moving. Just a couple of weeks ago we saw a late-May ramp which produced trend line breaks for several of the indexes. However, that move was quickly erased, and the market continues to correct as I type.
The sharp rally and turn-on-a-dime reversal to the downside of the past couple weeks negated most bullish patterns which were building in the charts of individual stocks, and the nonstop selloff since then has taken with it anything which looked remotely bearish. Clearly, there just hasn’t been much in the way of high-quality bases and the kinds of clean patterns I really prefer to see when swing trading.
My preference is to swing trade for overall account growth, and day trade to create cash flow. Operating on multiple timeframes allows me to not only maximize the use of my capital, but also to benefit from directional moves which don’t even have to be correlated. I may be short on a swing basis to participate in a multi-day correction, but there will be intraday bounces along the way which are worth day trading. That kind of approach works best for me, and forces me to not only stay aware of current conditions but also to keep an open mind for what could happen next.
So with little available in the way of swing setups in recent days, I’ve focused on day trading. I wanted to walk you through one of yesterday’s trades (highlighted in Wednesday’s Broadcast) and show you how finding a setup on the daily chart and then managing it via the intraday chart can benefit you.
The Setup
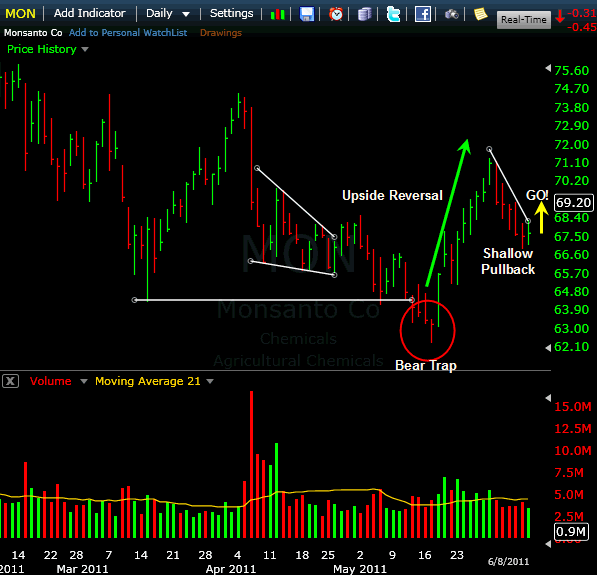
MON broke support in mid-May, but it proved to be a headfake and the stock turned sharply higher and tacked on a quick 10%. It pulled back early this month (along with the market), yet showed some nice relative strength by giving back only a portion of the previous move. There also was a clean descending trend line, which happened to be rather steep, marking the pace of the pullback. That offered a well-defined pivot for getting long, so I used $68.30 as my trigger for a long entry on Thursday. Here’s the setup:
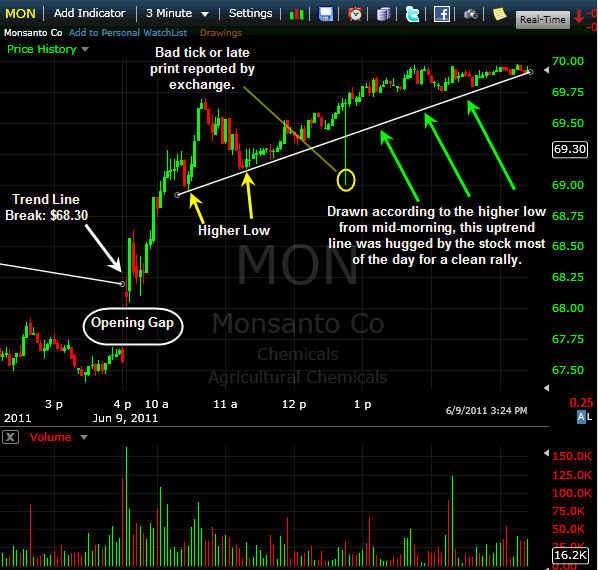
The stock cleared the trend line shortly after the open on Thursday, pushing past $68.30. About an hour later, it pulled back, but held above the prior intraday low (noted below). From there, it started to creep back up, allowing me to draw a very clean uptrend line which I then used as my get-out signal. Here’s the intraday chart:
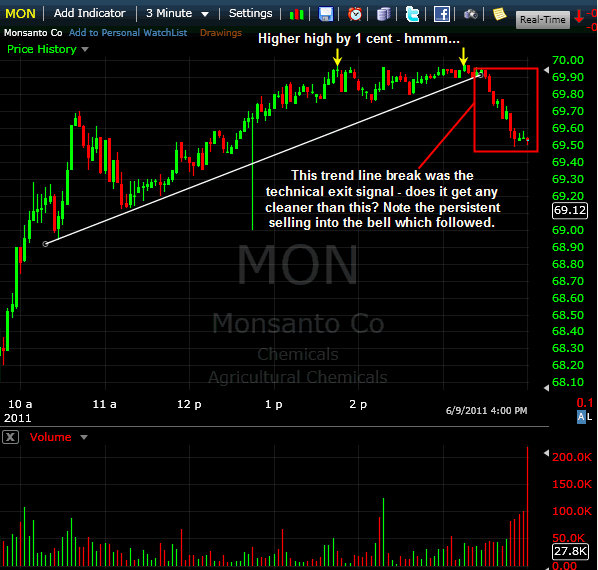
Late in the session, that uptrend line was broken to provide a technical exit and the stock slid lower into the closing bell as traders rushed to lock in profits. Here’s the chart showing the late-day break:
Takeaways from the Trade
Risk/Reward – As per my day trading strategy, my standard risk for day trades begins at 1% and is adjusted for volatility in the stock. This one required no special treatment, giving me an initial stop of 1%. As the stock trended higher in the opening hour, it made sense after a gap up open to expect that gap to hold, so I adjusted my stop to the low of the day (less than 0.5% –> even better!).
Intraday Trend – with the stock making regular higher lows intraday, it became clear that a change of that trend would warrant an exit. The emergence of a very clean uptrend line not only gave the stock a sustainable pace to rally, but also allowed for a well-defined, tight stop in case it were broken. I love finding setups on the daily chart and then trading them according to the intraday trend, and this is why.
Time of day – As the day progressed and the final hour arrived, MON made a new high by 1c as it cleared the previous high from 90 mins prior. Headfake. That break produced no follow through, which indicated that the high-level consolidation was in fact more of a battle than a rest. That alerted me to the idea of a failure at resistance, which happened soon after. The well-defined uptrend line was not far from price, so once it was broken it was clear that this was the time to ring the register and call it a trade (which traders did en masse). Grabbing a pain-free $1.60 or 2.3% isn’t bad for a few hours.
Trade Like a Bandit!
Jeff White
Producer of The Bandit Broadcast
Trading Against Key Levels
June 9, 2011 at 8:17 am
Pattern traders, technicians, and active traders in general love to watch for key levels. To some, it’s obvious to expect a reversal if that level is reached, while others expect a break.
Both sides have their case, and frankly, that’s what makes a market!
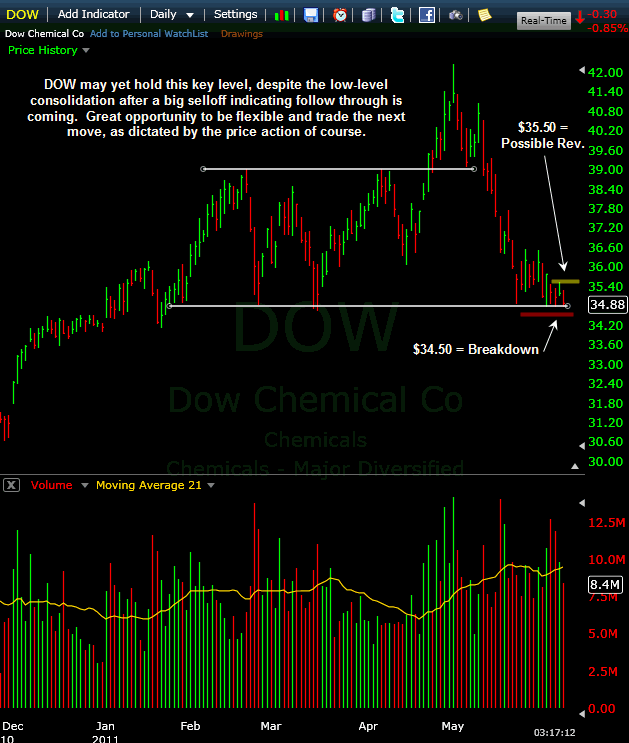
Today I wanted to point out an example of a stock I’ve been watching which has yet to do either. A key level – which has been tested multiple times not only in recent months but also in recent days – is the focal point right now, and one way or another I think there’s going to be a play. Here’s the setup:
DOW is clearly not in great shape here, as we’ve seen a steady slide from the May highs with every little bounce attempt getting sold. Plenty of distribution too as volume has spiked numerous times on recent selloffs. For the past 2+ weeks, the stock has lingered right near key support, looking like it could crack any day.
And yet it hasn’t.
The market overall has been very weak. The stock itself has yet to bounce, but it’s also ignoring a textbook breakdown opportunity here to really crack. And that has my attention.
At the start of this post, I mentioned how some traders are predisposed to watch for reversals and others watch for breakouts/breakdowns. I’m in the latter camp most of the time, and especially when the stock is consolidating against that level. DOW has been on my watch list for a breakdown in recent days, but I have yet to take an entry (since it hasn’t happened yet).
Currently, with the market oversold and this stock hanging tough like a NKOTB, I’m now open to a trade in the other direction (upside reversal). Isn’t that one of the huge advantages of trading the market? It’s like putting money on a horse when it’s running the back stretch, well after the race has started. The willingness to switch directions or modify (or reverse) an opinion is something flexible traders must have. This is one of those chances.
How I’ll approach this one is to use $35.50 (multi-day high) as a pivot for getting long, and $34.50 (breakdown) as a pivot for going short.
Trade Like a Bandit!
Jeff White
Producer of The Bandit Broadcast


