 Author Archive for Jeff White
Jeff White is the founder of www.TheStockBandit.com, a nightly newsletter for active traders. He has been trading his own account for over a decade and currently trades full time in Texas.
Video Review of the Indexes 12-13-2009
December 13, 2009 at 3:08 pm
This market is at home on the range, and just one glance of the daily charts over the past several weeks makes it clear that the standoff between buyers and sellers is still in effect. The bulls have maintained control for 9 months and counting, yet with a wonderful opportunity to produce a breakout and stretch their legs a bit, they’re hesitating. Why?
Who knows. The fact of the matter is that as traders, you and I must recognize such things as a trading range, and adjust as needed in order to survive. For me, that has meant keeping tighter stops and staying selective until better momentum surfaces. Eventually, this too shall pass, so hang in there!
As we head into a brand new week of trading, let’s examine some important levels in the indexes to keep an eye on in the days ahead. That will have the greatest influence on how individual stocks are going to move, so it’s where the trading week begins.
This clip was also posted over on the Trading Videos site (as always), and perhaps you’ve seen it there – but in case you didn’t, I wanted to put it here on the blog for you.
Let me highly suggest clicking the “HD” on the video player and then going full-screen for best quality.
Thanks for stopping by and I’ll see you here soon with more.
Until then… Trade Like a Bandit!
Jeff White
Are you following me on Twitter yet?
Pattern Failures Are Worth Noting
December 8, 2009 at 2:44 pm
While the bulk of my trading revolves around chart patterns, and most notably the confirmation of them, failed patterns are certainly worth identifying.
Anytime a stock appears to be gearing up to make a move in one direction and suddenly goes the opposite direction, you can bet there are plenty of participants who are poorly positioned. Such is the case when patterns fail.
Obviously, the original plan goes out the window when a chart pattern fails, but that doesn’t mean you should turn your back on the stock. In fact, watching for plays to emerge in the new direction can often prove fruitful.
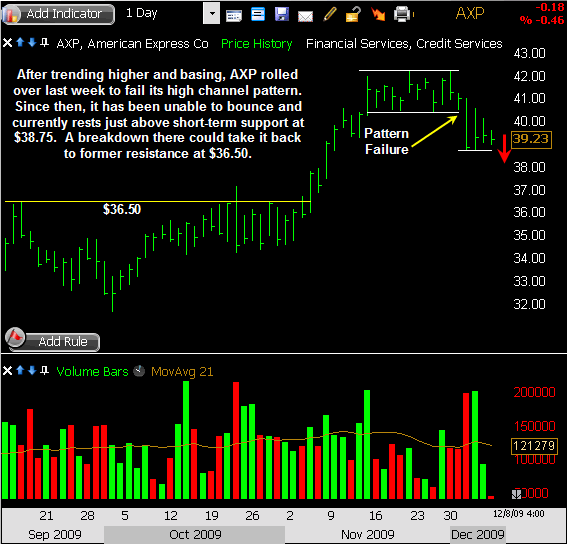
I just ran across an example that I wanted to point out to you. AXP had created a continuation pattern with a high channel following an uptrend, but price fell out of that channel last week to the downside. Now the stock is setting up for a possible secondary move downward, and it’s on my radar after seeing this chart today.
Here’s a look at it:
Trade Like a Bandit!
Jeff White
Are you following me on Twitter yet?
Video Review of the Indexes 12-6-2009
December 4, 2009 at 10:22 pm
The major averages each pushed north of new highs last week, but only temporarily. Intraday milestones simply don’t carry the same weight as those which occur on a closing basis, and last week proved to be no different as resistance was cleared, only to be given right back by the end of the session on Wednesday, Thursday and Friday. Will this next week prove to be any different, or will the trading ranges persist yet again?
As we head into a brand new week of trading, let’s examine some important levels in the indexes to keep an eye on in the days ahead. That will have the greatest influence on how individual stocks are going to move, so it’s where the trading week begins.
This clip was also posted over on the Trading Videos site (as always), and perhaps you’ve seen it there – but in case you didn’t, I wanted to put it here on the blog for you.
Let me highly suggest clicking the “HD” on the video player and then going full-screen for best quality.
Thanks for stopping by and I’ll see you here soon with more.
Until then… Trade Like a Bandit!
Jeff White
Are you following me on Twitter yet?
Video Review of the Indexes 11-22-2009
November 22, 2009 at 3:50 pm
A push to new highs just happened once again, and the bulls remain in control of the tape despite the weak finish which erased the gains from earlier in the week. Higher highs in place means the uptrends are still intact, and that certainly deserves our respect.
Speaking of respect, this week we’re very likely to see some extremely light volume as the Thanksgiving holiday rolls around. With the market closed on Thursday and open for a 1/2 day on Friday, the end of the week could be extra quiet. Before then though, it’s wise that we remember the light activity we’ll probably see, and trade smaller as a result. Throwing caution to the wind and pressing forward as if it’s a typical week isn’t the way to go, so respect the lack of participation out there and make adjustments accordingly.
As we head into a brand new week of trading, let’s examine some important levels in the indexes to keep an eye on in the days ahead. That will have the greatest influence on how individual stocks are going to move, so it’s where the trading week begins.
This clip was also posted over on the Trading Videos site (as always), and perhaps you’ve seen it there – but in case you didn’t, I wanted to put it here on the blog for you.
Let me highly suggest clicking the “HD” on the video player and then going full-screen for best quality.
Thanks for stopping by and I’ll see you here soon with more.
Until then… Trade Like a Bandit!
Jeff White
Are you following me on Twitter yet?
4 Cup & Handle Patterns to Watch
November 17, 2009 at 3:02 pm
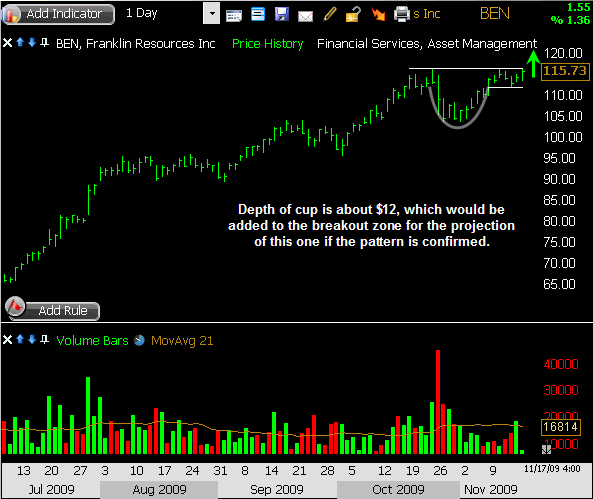
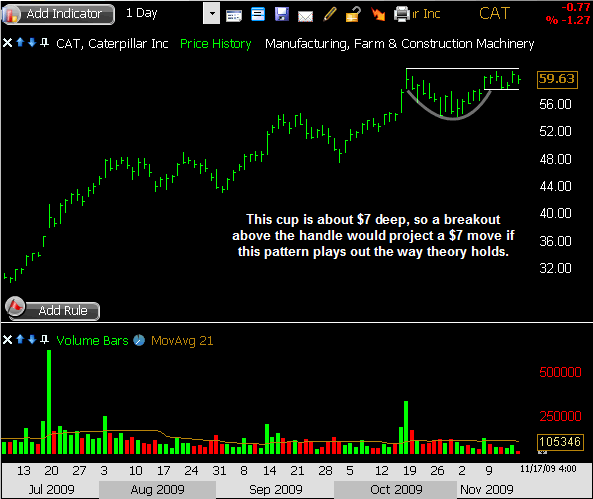
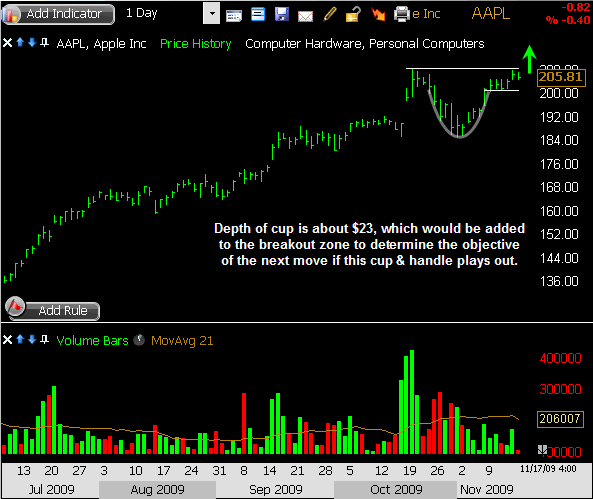
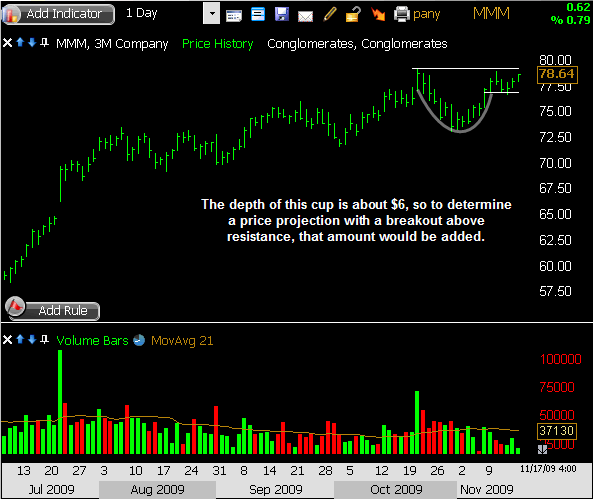
One of the most easily identifiable chart patterns is also one of the rarest – the cup and handle pattern. In this post, I want to show you a few which are developing right now.
The cup and handle pattern is sometimes misinterpreted, so let’s just review the basics…
First, this pattern must be found within the context of an uptrend. This is an upside continuation pattern, so the existing uptrend is a necessity.
Second, the height of the cup is important to note. This is the depth or distance from upper resistance to the low end of the cup, and it’s added to the breakout zone in order to determine a price target.
Third, a rounded cup is ideal. This suggests there were no sudden or sharp changes of direction, but merely a mild pullback and gradual recovery.
Finally, the handle portion will resemble a narrow channel, sometimes tilted downward, and may occur on light volume. This is the coiling action which will precede the breakout, and it gives the pattern not only recognition but also validity.
I just ran across a handful of examples that I wanted to point out to you. These are currently building their handles and may need more time to mature. The key is that this pattern is only confirmed upon a breakout, so that’s what I’ll be waiting for.
Trade Like a Bandit!
Jeff White
Are you following me on Twitter yet?
CVX Bull Flag Offers Potential
November 10, 2009 at 9:44 am
My nightly routine includes locating setups for tomorrow’s trading session, but I don’t want to stop there. Taking it one step further, I want to be aware of any other stocks which may be gearing up for moves in the days ahead – radar stocks, if you will.
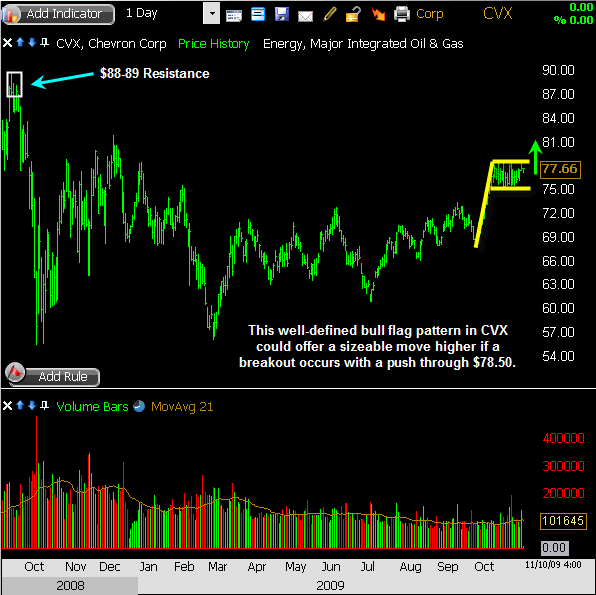
One setup that’s been on my radar for the past few days is CVX. The stock has trended steadily higher from the July low, and more sharply from the October low. Since then, it has settled into a very well-defined trading range over the past 3 1/2 weeks. The rally-and-base combination has built a very clean bull flag pattern, which offers not only a technical entry on a breakout but also an exit if that pattern should happen to fail.
I have no position here yet, but if this one clears $78.50 to break out from the bull flag, I’ll get real interested real fast.
A measured move could take this one on up to the $88-89 area, which would coincide with a resistance zone from August and September of 2008.
Here’s a closer look:
Trade Like a Bandit!
Jeff White
Are you following me on Twitter yet?
Managing Day Trades Effectively
November 9, 2009 at 11:14 am
Would you rather make money by the minute, or by the day?
I’m open to either, so why not both! I like swing trading for the set-it-and-forget-it benefits it offers, as I can structure my trade and manage it with little effort on a multi-day timeframe. The time requirements are minimal, and the payoffs can be great. But I also like day trading and the flexibility it offers. I can enter the day with zero directional bias, and still find some opportunities to capitalize on from the intraday chart patterns.
Trading multiple timeframes is one of the best ways to diversify as a trader, there’s no getting around it. But let’s explore this idea a little further of managing day trades, because that’s one subject so many seem to struggle with.
R & R
It’s no secret that the key to good trading – for most of us anyway – isn’t how frequently we’re correct, but rather how big we’re correct. After all, we’re going to be right sometimes and wrong sometimes, so the net difference is where the rubber meets the road. For me, that comes directly from the size of my winners as compared to the size of my losing trades, or my risk-reward ratios. Let me repeat: it’s not really the frequency of wins that matters… it’s the size of them.
So if that holds true, then it’s true across all timeframes. From the position trades you might hold for a few months, to the swing trades of a couple weeks, to the day trades which might last a couple of hours, the key is risk vs. reward.
Deciding on Day Trades
In the Bandit Hideout, there’s a nightly video newsletter called the Bandit Broadcast. It contains setups for plays across multiple timeframes, from the swing trades I’m considering over the coming days, to the day trades I’ll be making tomorrow. The day trades are for brief, short-term moves of up to a few hours. They look like on the daily charts that they could make a quick move but not necessarily a lasting one, so instead of holding them overnight I simply look to grab them for the initial move and then ring the register and set them free.
For these plays, I’m not trying to endure pullbacks or wait around to see if it’ll keep running for several days. So once I’ve determined if a stock is trade-worthy, I tend to watch 3-minute bars and simply look for the same kinds of chart patterns I seek on the daily charts….channels, flags, wedges, triangles, etc. The same patterns will still play out across timeframes, which I’ve long said is the beauty of chart patterns and technical trading.
The Other ‘E’
When I find a setup that looks suitable for a quick play, my attention isn’t solely based on where my entry will be. Too many traders focus on that alone, and in return, fail to recognize the other half of the equation – the exit.
For stops, I usually set about 1% from entry as a stop (as outlined in the day trading strategy). The previous day’s low is often much farther from there, so I really just focus on today’s chart and try to first and foremost limit risk.
After that, it is a matter of gauging momentum by monitoring the volume, strength, and pace of the advance so that I don’t overstay my welcome. I’ll gladly offer out shares in chunks on the way up, scaling out and using the strength to my advantage. Once the momentum fades, I’m outta there.
I really like the advantages that swing trading offers me when it comes to setting up plays and letting them work, but I simply can’t deny some of the aspects of day trading which offer flexibility and potential for grabbing short-term moves.
So as you construct your day trading strategy, be sure that it’s suitable to your unique needs as a trader. You might be willing to withstand more risk than the next trader – or less. You might prefer to exit in pieces, or you might like jumping out all at once when your stop or target levels are hit. Whatever your style may be, just be sure to stick to it for maximum consistency. It’s how you’ll manage your day trades most effectively.
Thanks for stopping by and I’ll see you here soon with more. Until then…
Trade Like a Bandit!
Jeff White
Are you following me on Twitter yet?


