 Author Archive for Jeff White
Jeff White is the founder of www.TheStockBandit.com, a nightly newsletter for active traders. He has been trading his own account for over a decade and currently trades full time in Texas.
Video Review of the Indexes 11-8-2009
November 8, 2009 at 2:39 pm
After a pretty decent pullback from the October highs, the dip-buyers were faced with another opportunity, and last week they began to do their thing once again. An upside reversal on Monday paved the way for higher prices to come, and by the end of the week a respectable bounce was here.
There are some mixed signals on a technical basis which are still worth noting here, and that should keep the trading environment an interesting one for the foreseeable future. We have volatility starting to expand, stocks trending in different directions, and earnings season starting to wind down.
As we head into a brand new week of trading, let’s examine some important levels in the indexes to keep an eye on in the days ahead. That will have the greatest influence on how individual stocks are going to move, so it’s where the trading week begins.
This clip was also posted over on the Trading Videos site (as always), and perhaps you’ve seen it there – but in case you didn’t, I wanted to put it here on the blog for you.
Let me highly suggest clicking the “HD” on the video player and then going full-screen for best quality.
Thanks for stopping by and I’ll see you here soon with more.
Until then… Trade Like a Bandit!
Jeff White
Are you following me on Twitter yet?
APOL Flirting with Breakdown from ‘h’ Pattern
November 6, 2009 at 11:01 am
Classic chart patterns still work quite well, and I trade them regularly, but they aren’t the only patterns out there to watch for.
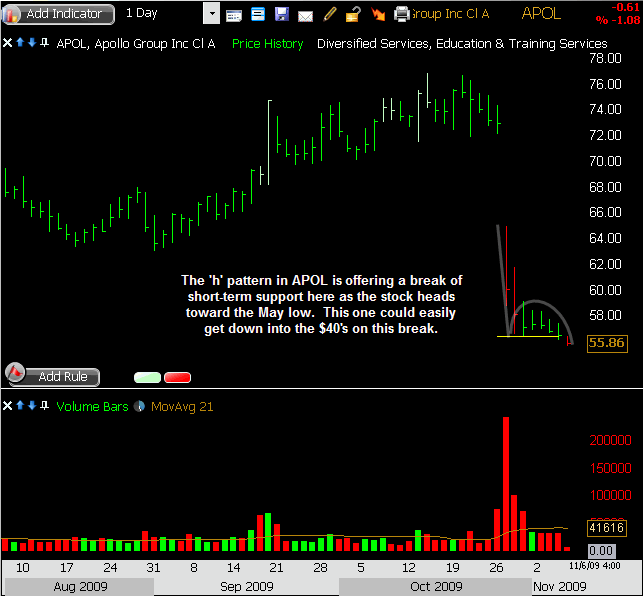
One pattern I’ve taken notice of in recent months is the ‘h’ pattern. This happens when a stock has a sudden or steep decline followed by a very quiet and weak bounce. The bounce begins to fail, and the price pattern resembles a lower-case h.
The way I trade the ‘h’ is to go short upon a break of the support level. It can offer an entry on the short side for a secondary move lower, and can carry a nice risk/reward profile with it.
APOL has this pattern right now and it’s starting to undercut support here. The stock has already been very weak since late-October, but it’s struggled to rebound. It bounced from the $55.35 level back in May, but below that the next stop could be in the $40’s.
Here’s one that’s worth a look.
Trade Like a Bandit!
Jeff White
Are you following me on Twitter yet?
Video Review of the Indexes 11-1-2009
November 1, 2009 at 2:07 pm
The major averages sold off hard last week as profit-taking dominated the action. The lone advance happened on Thursday, but Friday’s selling pressure alone had no trouble erasing it.
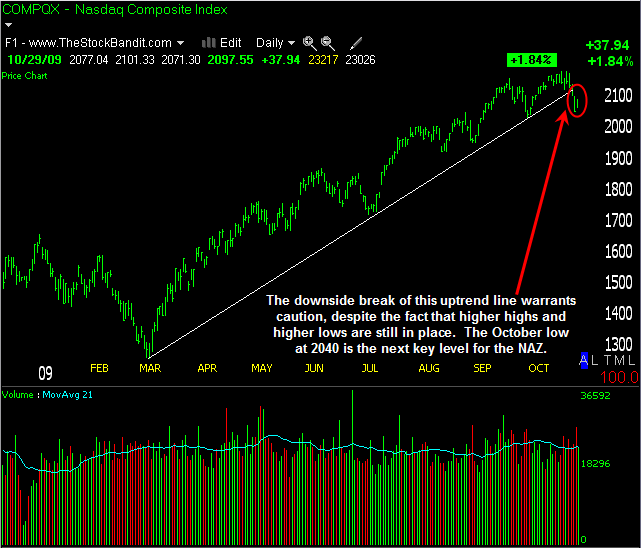
The NAZ is now facing a very critical level, and the overall character of this market is quickly changing. Volatility is expanding, and suddenly traders are remembering that the market can indeed move both directions.
As we head into a brand new week of trading, let’s examine some important levels in the indexes to keep an eye on in the days ahead. That will have the greatest influence on how individual stocks are going to move, so it’s where the trading week begins.
This clip was also posted over on the Trading Videos site (as always), and perhaps you’ve seen it there – but in case you didn’t, I wanted to put it here on the blog for you.
Let me highly suggest clicking the “HD” on the video player and then going full-screen for best quality.
Thanks for stopping by and I’ll see you here soon with more.
Until then… Trade Like a Bandit!
Jeff White
Are you following me on Twitter yet?
Oversold Bounce or Higher Low?
October 29, 2009 at 9:51 pm
Following an impressive surge higher from early October, the market has finally taken a breather. The pullback of the past week has offered at least a short-term change of character that has my attention – and yours as well, I’m sure.
Downside follow through has been notably absent for some time now…until this week. Four consecutive declines began with last Friday’s reversal from the highs in the NAZ (2190), and ended with Wednesday’s punishing selloff. Thursday’s bounce was headlined by a near-200-point jump on the DJIA, but under the surface we saw the NAZ post an inside day. The S&P 500 erased Wednesday’s losses, but on declining volume. Mixed signals, to say the least.
Looking at the daily charts of the indexes, a case can be made for more than one scenario here. We are in well-defined uptrends, and the dip of the past week could again get bought and prove to be yet another higher relative low within the trend. But by the same token, the bounce we saw on Thursday could merely prove to be a relief rally after the harsh selling which put the market short-term oversold. It’s hard to place my entire weight on either scenario just yet, as more technical evidence needs to be seen to support one or the other.
So at this point, I’m making zero predictions. This isn’t a spot to buy blindly and bank on another rally straight back up to new highs. The selling intensity we just saw wasn’t like the modest pullbacks which preceded it. It was a little more vicious and a little more ominous. It could be the start of a change of character. And this isn’t a time to call for a market top and start shorting the daylights out of every name out there. The intermediate trend is still up, and that should be respected.
I’m expecting the next few days to carry some significance. Either the bulls prove themselves yet again, or the bears build on their newfound confidence and we see another leg down begin to develop. Personally, I don’t care which side wins out – I have no bias.
My approach is to stay very short-term for the next couple of sessions, day trading for quick moves in this increased volatility, and see what happens. Many stocks broke down hard and have the potential to construct bear flags and rising wedges if the rebound loses momentum and volume continues to sag. I’ll be watching those bounces intently. Other stocks still aren’t far from their highs, so I’ll observe them closely for signs of real strength returning – not simply a relief bounce of one day.
Both the bulls and bears have something to prove these next few sessions, so it could wind up being a pretty good battle. No matter what, volatility is picking up, and that’s a great thing for us as traders.
So stay objective out there, anything is possible. Expect surprises in both directions. We’re getting into the best season for trading in the next several months, and I’m excited about it!
Trade Like a Bandit!
Jeff White
Are you following me on Twitter yet?
Video Review of the Indexes 10-25-2009
October 25, 2009 at 4:27 pm
The bulls produced new recovery highs last week (again), but as the week wound down, it appeared as though some fatigue may be setting in. Not only did we see bearish engulfing bars on Wednesday and no new highs after that, but we are also seeing some rest set in with the establishment of short-term trading ranges. Prices are currently sitting just above some key levels, so if we see those get broken, it could bring some profit-taking into the picture.
As we head into a brand new week of trading, let’s examine some important levels in the indexes to keep an eye on in the days ahead. That will have the greatest influence on how individual stocks are going to move, so it’s where the trading week begins.
This clip was also posted over on the Trading Videos site (as always), and perhaps you’ve seen it there – but in case you didn’t, I wanted to put it here on the blog for you.
Quick Announcement: I just want to remind you to join our free newsletter list for trading insights by email. If you’ve been on the list in the past, it has changed, and you’ll need to opt in here to receive it going forward.
Let me highly suggest clicking the “HD” on the video player and then going full-screen for best quality.
Thanks for stopping by and I’ll see you here soon with more.
Until then… Trade Like a Bandit!
Jeff White
Are you following me on Twitter yet?
Bearish Engulfing Bars Warrant Caution
October 21, 2009 at 9:35 pm
Following gains of more than 7% in just a dozen days, today we saw the market averages tag new recovery highs and then reverse sharply to finish in the red. The bearish engulfing bars which resulted on the daily charts aren’t pretty, especially given the elevated volume which accompanied them.
It hints that this market is finally showing us a little fatigue, and that perhaps more than a few buyers morphed into sellers – at least for today.
If we did see a pullback begin to develop here, it wouldn’t at all be an unhealthy thing. Several dips have occurred since the March lows were set, with each of them being bought. Now, at some point that is going to change – it’s imperative to understand that – but we don’t yet have enough technical evidence to jump to conclusions at this point for anything but the next few days. And on that note, caution is warranted after today’s action.
Just a little while ago over on the trading videos site, I posted the following video. In it, I discuss what took place today, and offer up a few levels on the downside we could see tested if Wednesday’s selling pressure sees follow through.
Let me highly suggest clicking the “HD” on the video player and then going full-screen for best quality.
Thanks for stopping by and I’ll see you here soon with more. Until then…
Trade Like a Bandit!
Jeff White
Are you following me on Twitter yet?
Why I’m Not Trading AAPL
October 19, 2009 at 10:27 am
AAPL is set to report earnings after today’s closing bell. It’ll be the focus of attention at times both today and tomorrow as the dust settles post-news, but truth be told, I have no interest either way.
Obviously it’s one of my trading rules to avoid stocks when they’re reporting earnings, as scheduled fundamental news simply carries with it no edge for me as a technical trader.
But I’ve had no interest in trading AAPL for a few months now. Let me explain why.
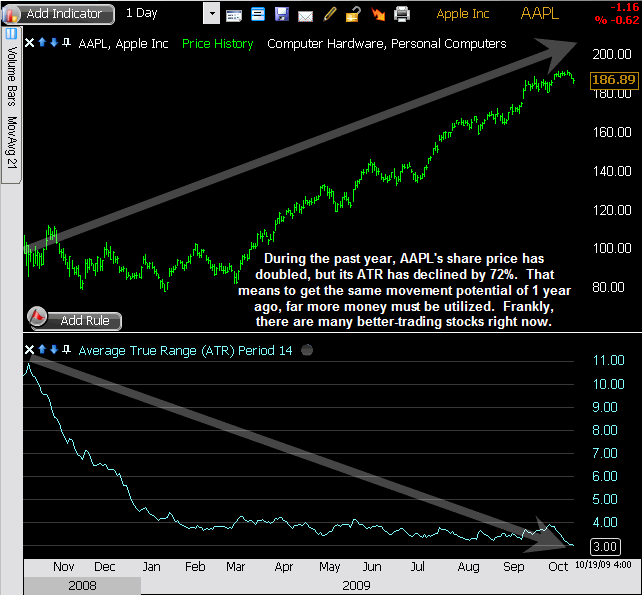
The short answer is that AAPL simply doesn’t move enough. For a stock that’s highly liquid (over 15 million shares/day on average) and within sneezing distance of $200, it should move a lot. And yet it doesn’t. On an average day, it’ll see an Average True Range (ATR) of about $3. There are stocks trading at a fraction of AAPL’s price which move that much and are still highly liquid, so why pay up for less movement?
Let’s take a look at the chart.
Over the past year, we’ve seen AAPL’s price rise dramatically, while its movement has shrunken dramatically. ATR is a price-based measurement (not percent), so as price gets higher and higher, often times we’ll see ATR expand along with that. That’s not the case with this stock.

StockFinder Chart courtesy of Worden
Anytime you’re trading the high-priced stocks, do your best to gauge whether there’s enough movement there on an average day to justify an entry. Others like GOOG, CME, and BIDU all are higher-priced than AAPL, but on a relative basis (when comparing ATR) they each move considerably more than AAPL.
At some point, AAPL will be worth trading again, but on an average day right now, the moves are just too limited to warrant an entry.
Thanks for stopping by and I’ll see you here soon with more. Until then…
Trade Like a Bandit!
Jeff White
Are you following me on Twitter yet?


