 All Entries in the "Chart Reviews" Category
Homebuilder Stocks on Solid Foundations
August 3, 2010 at 7:12 am
The stock market is often times simply a market of stocks, meaning that it’s necessary to sift through them all in order to find some which appear tradeable.
Occasionally though, we notice sectors moving in tandem, giving us multiple opportunities in the same group. That sometimes gives us a chance to identify leaders and laggards, while other times it shows us greater confirmation that something is developing.
Right now is one of those times for the stocks of homebuilders.
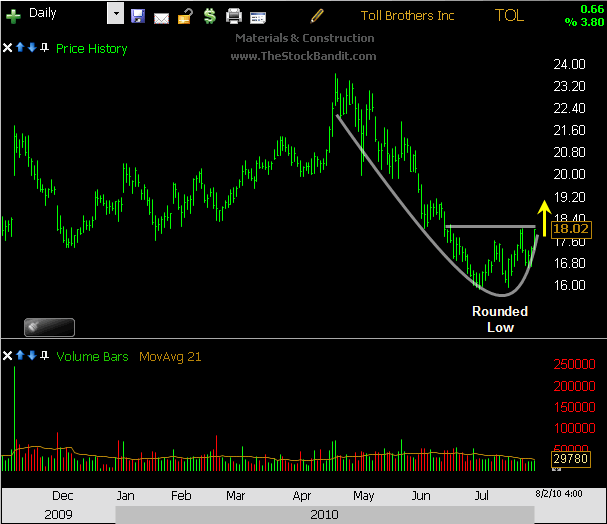
Most of them have similar chart patterns, which is the rounded bottom pattern (or rounded low), and they’re setting up to confirm bullish reversals in the coming weeks and months.
The (Floor) Plan
Moves which are expected to take up to a couple of months is a longer timeframe than I generally tend to trade, but the nature of this pattern is such that it should take longer to play out. So, my plan in trading these is to establish small positions, add to them upon further technical evidence of a trend shift, and manage them as position trades. Because I’m an active trader and expect these to work over the course of a couple of months, I don’t want them on my screen every day. As a result, I’ll be utilizing long-term retirement accounts as the ‘home’ for these homebuilders.
Keep in mind, I’ll be maintaining protective stops just in case these patterns don’t pan out, and I will be starting small and looking to add later. But the technical foundations are there for these longer-term patterns to play out, and I like the risk/reward they’re offering.
Here’s a quick rundown of several I’m seeing…
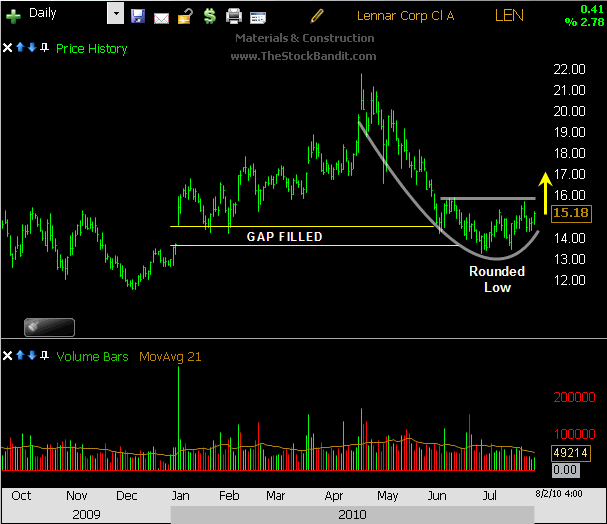
LEN trended lower from its April price spike to fill a gap from January, which is technically healthy. In recent weeks, the downtrend has stalled as price is stabilizing just beneath resistance:
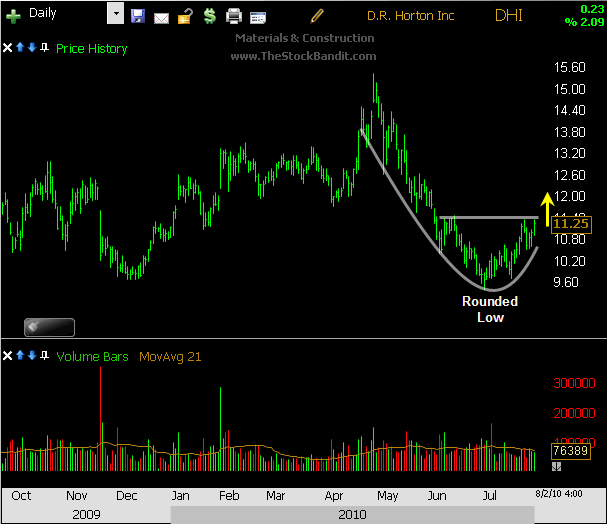
DHI pulled back enough to take out its December 2009 low, and not by much. That kind of move often shakes out some traders who will now likely add to the strength by jumping back on board if this rounded low pattern is confirmed:
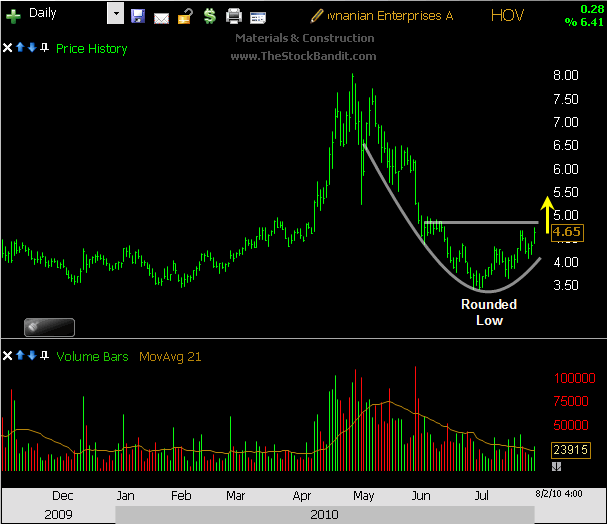
HOV briefly undercut support from early this year on its latest selloff, which was a nasty 57% correction. Price has stabilized in recent weeks with some short-term higher lows, and this one still has plenty of room to rally:
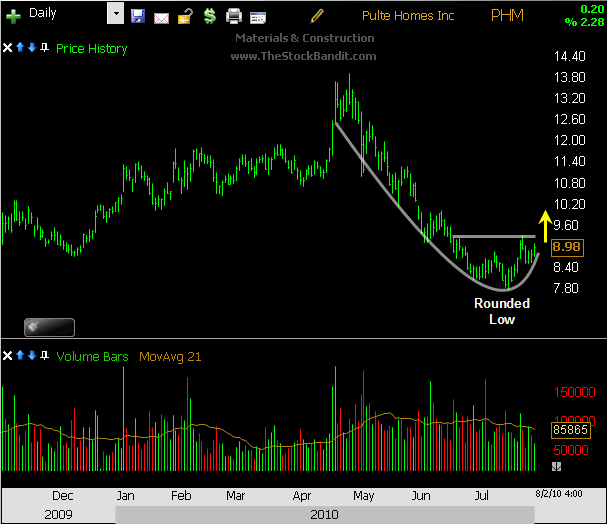
PHM trended persistently lower after topping in late-April, and two positive things have happened since then. First, the decline has made no progress in 2 weeks. Second, a rounded low is in place, which if confirmed, could ignite a solid push higher as this one retraces at least a portion of the May-July selloff:
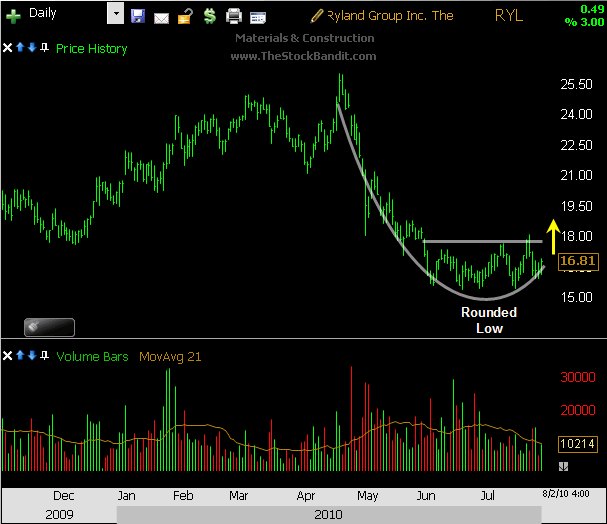
RYL sold off sharply from its April highs, but for the past several weeks, price has stabilized and established support. A move up through resistance would set this stock on the path toward higher prices:
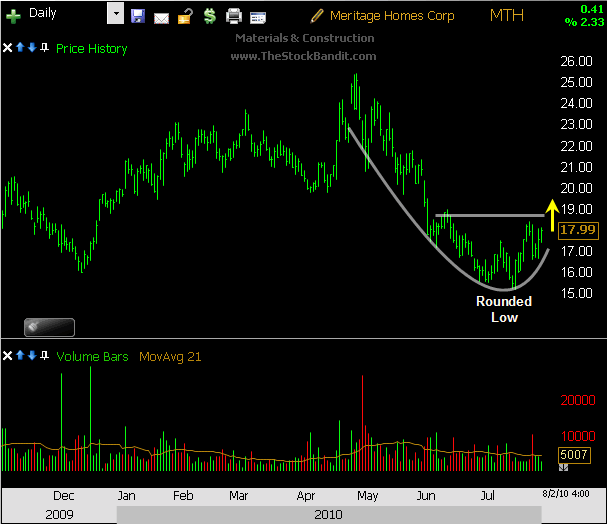
MTH has found recent support after a big correction, and here again, the rounded low would be confirmed with a move up through resistance:
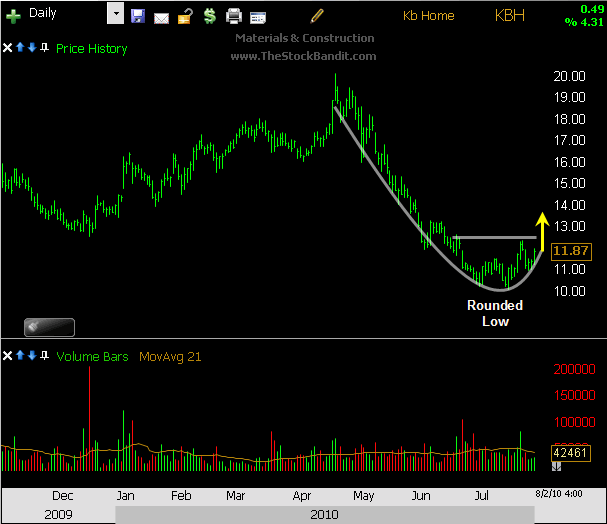
KBH was cut in half from its April peak to July low, and in recent weeks has carved out support. Price is now beginning to curl higher, and a move through resistance would confirm that:
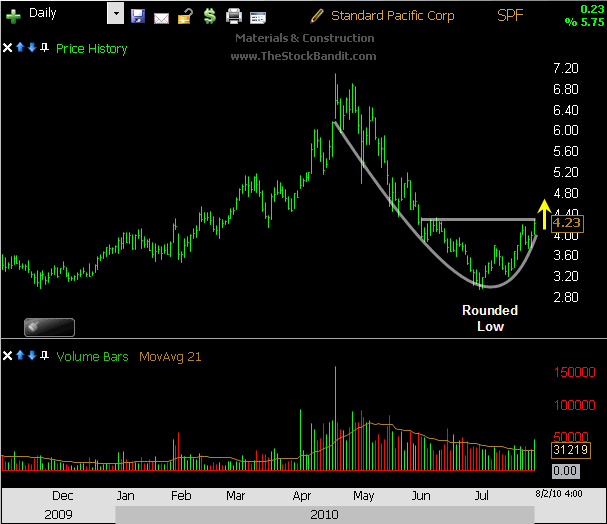
SPF gave up 58% during its harsh selloff between April and July, but now is gaining strength and looking to accelerate higher if resistance is cleared:
Finally, TOL is looking good after finding support in July and creating some short-term higher lows in recent weeks. A push through resistance would free up this stock for higher prices as well:
Trade Like a Bandit!
Jeff White
Swing Trading & Day Trading Service
www.TheStockBandit.com
Are you following me on Twitter yet?
GS Getting Ready
July 27, 2010 at 7:23 am
Financial stocks are always on the radar of traders, and GS is usually at the top of the list. Interestingly, this one looks like it’s gearing up for a move of its own.
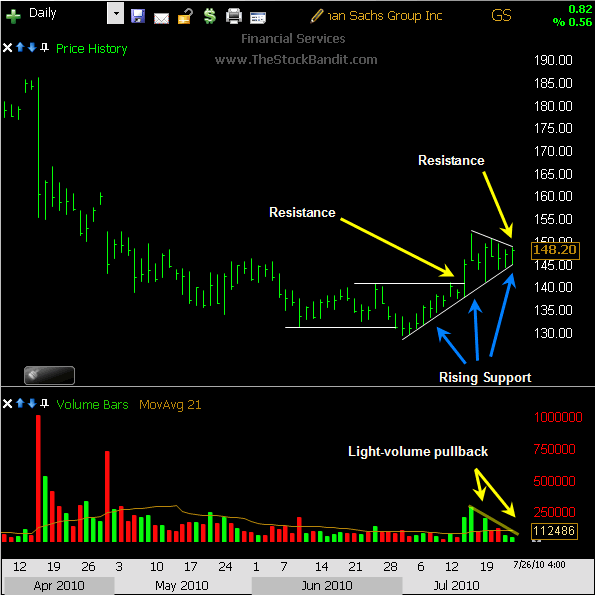
After undercutting support on July 1st, the stock began to grind higher, eventually taking out the late-June high on strong volume. Since then, a rising trend line from the low has served numerous times as support. Over the past several sessions, some narrowing consolidation has been seen with the creation of a small descending trend line just overhead. These two trend lines are now squeezing price in a pressure-chamber fashion, and one of them is about to give.
Typically when two trend lines are vying for control, the longer one tends to win out. In this case, that could bring an upside resolution to this pattern. In keeping with the recent market strength, that’s a distinct possibility.
I’m watching GS for a push through the trend line at $149.10 for a trade. Earnings have already been released, and this is a highly liquid stock. Could be good for a few quick points, but the buyers will have to emerge and push prices beyond the trend line in order to get it. An unfilled gap from April extends to the $160 area.
If instead the lower trend line is broken (currently at $145), that would be a failure of this bullish pattern and would leave the stock vulnerable to at least a partial retracement of this bounce.
Here’s a closer look for you:
Trade Like a Bandit!
Jeff White
Swing Trading & Day Trading Service
www.TheStockBandit.com
Are you following me on Twitter yet?
Bidding On BIDU
July 26, 2010 at 7:19 am
When trades come along which offer potential on multiple timeframes, I always perk up. If one timeframe doesn’t appeal to me, the other can still add to my account.
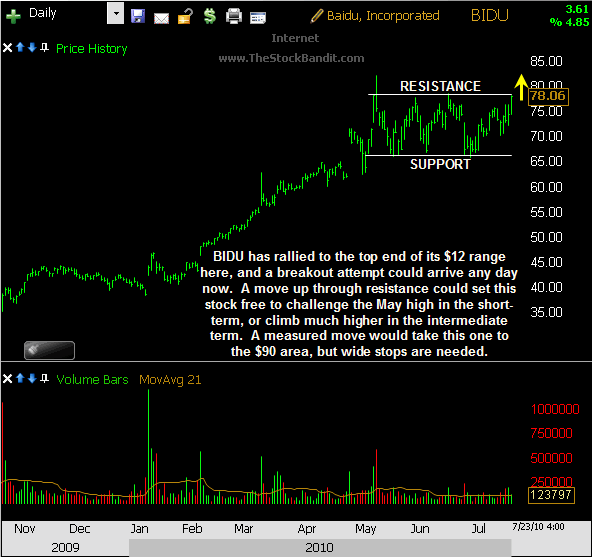
BIDU is one such setup right here. The channeling stock has been range-bound since early May, and a breakout may be coming soon from this rectangle pattern. Upper resistance is well-defined, offering day traders a quick-hit setup for an intraday breakout play. But with confirmation of a breakout – meaning, a close above that resistance level – swing traders also have a shot at a measured move to develop in the coming weeks for a $12 advance to the $90 area.
A breakout could come any day in BIDU, so I’ve got it on my radar for a trade if it can push through the $78.65 resistance area. This one doesn’t have a real clear-cut exit as a swing trade, so it isn’t one I’m planning to keep a long time… Just long enough to get paid and move on to the next idea.
Here’s a closer look for you:
Trade Like a Bandit!
Jeff White
Swing Trading & Day Trading Service
www.TheStockBandit.com
Are you following me on Twitter yet?
Intraday Extremes Offer Big Opportunities
July 20, 2010 at 9:02 am
The old adage says to ‘buy low and sell high.’ That’s misinterpreted by most, as they tend to sell their strongest stocks when strength is still present or buy before corrections are completed.
To the inexperienced, it may look like the move is done, but often times is followed by an encore of sorts. Timing is everything, indeed.
Extremes can really pay quite well. When fear is at its highest, it’s a great time to get long. And when everybody and their mom is making money, it’s certainly time to raise cash. But for the sake of this post, I’m not talking about buying a “generational low” or calling a long-term top in the market. In fact, I’m not even referring to the daily timeframe here.
I’m talking about how some of the best trades will happen at extremes…
…the kind which are found intraday.
Profit Where Others Fail to Look
Define it however you like, but at the heart of it, an extreme is approaching quickly whenever a move is unfolding at an unsustainable pace.
That might be a parabolic uptrend, or intraday capitulation. An extreme is a price spike which is showing exceptional momentum now, but the enthusiasm is beginning to fade, and soon there’s going to be a reactionary move.
That reactionary move is the one you and I can catch most often. I say that because once we see a stock that’s really on the run, the odds are that the easy money has been made for that particular move. Attempting to join the move means chasing price without a clear-cut exit plan, and that’s a huge no-no for any professional trader. So, the reactionary move is the money train for those who missed the original move.
What’s so funny is that most traders see a huge intraday run and just know they missed it. Don’t be as closed-minded as them. They drool over what it would have been like to be on board, and fail to recognize the opportunity that’s about to unfold. Dare I say, a more defined-risk opportunity.
You Missed the ‘Move’ – So What?
Take Monday for example. Education stocks bolted higher in the morning, ripping through offers on the way up as they painted the tape bright green. By the time most of us noticed them, they’d already put up very impressive gains.
Maybe you saw APOL, ESI, COCO, DV and others up in the neighborhood of 10% in just the opening few minutes. It looked like they could keep going, but suddenly the buying frenzy morphed into profit-taking, and thus, opportunity arrived.
RIG provided an excellent move for me (from Sunday night’s premium newsletter), but my most profitable trade of the day actually came in a short sale of ESI. Let’s take a look…
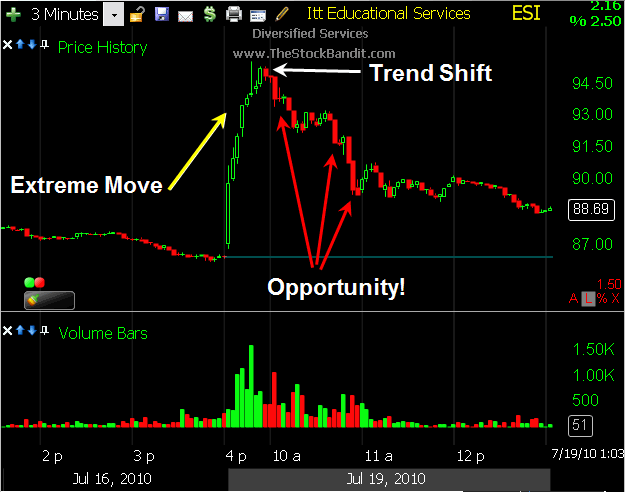
ESI ripped higher by $9 right off the open Monday, but I wasn’t long. It was up about $6 by the time I noticed it, and I’m not a buyer of that kind of strength. So instead, I waited for the enthusiasm to wane. And shortly after, it did.
The stock had painted a high of $95.62, and then backed off slightly. It spent several minutes consolidating, and then on the 3-minute chart I saw something noteworthy. I shorted at $95.10, set a protective buy stop up above, and waited to see if profit-taking would develop.
An hour later, the stock was more than $6 lower, trading in the low $89’s, and I was out of the last of my shares (after scaling out). It didn’t last long, but the overreaction on the upside was followed by a nice reaction on the downside, and that was the move that paid me.
Here’s a closer look:
I outline my entire method for trading these extreme reversals in my Advanced Trading Course, so the specific details are reserved for students, but I will give you a few general pointers here.
Profiting from extremes begins with a mindset shift. When you see a giant move, don’t kick yourself for missing it. Instead, start looking for a way to profit once it’s over. Be creative – the market requires it!
Take note of intraday extremes. Don’t chase them, just watch them. See if the pace of the move begins to slow down, and at the first sign of a turn, you’ll know you’re looking at an opportunity. They will not all pan out, but the risk/reward associated with them makes them well worth studying, and often times quite lucrative to trade.
Trade Like a Bandit!
Jeff White
Swing Trading & Day Trading Service
www.TheStockBandit.com
Are you following me on Twitter yet?
Several Solars Set to Shine
July 19, 2010 at 7:17 am
Last week I discussed timing themes and the benefit of seeing repetition in the markets, but that’s just one way the astute trader can locate profits. Another is to notice sectors and groups which are seeing rotation.
Currently, solar stocks are making quiet but steady headway, exhibiting some very nice relative strength. While the market is bouncing from its most recent correction low, several solars are already in uptrends, boasting higher lows and higher highs.
Even better, there are a few of them which are looking poised for higher prices, provided of course that the patterns they’ve built are indeed confirmed.
I wanted to bring a few to you today and put them on your radar. Here’s a quick rundown of some setups I’m seeing…
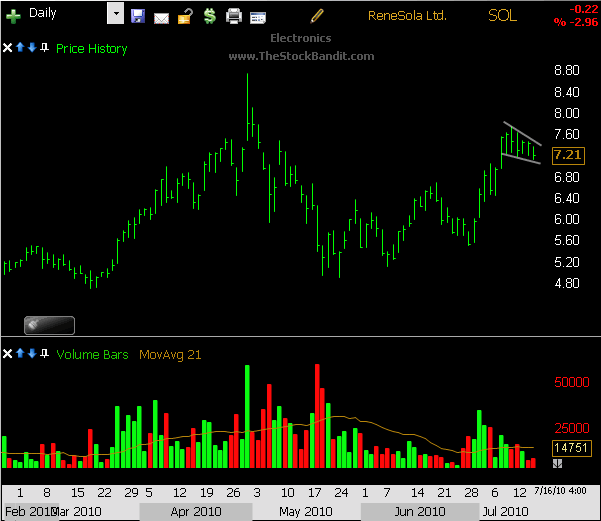
SOL is pulling back in a shallow fashion here after a nice run, creating a bull pennant pattern. An upside resolution to this pattern could send this stock heading toward the spring highs:
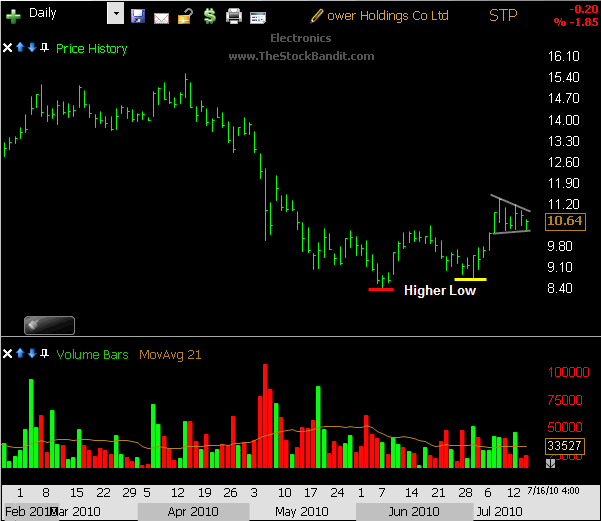
STP just confirmed a higher low with the creation of a higher high, and has been resting for a week. A return of strength would give this one plenty of room to run higher, but the consolidation area needs to be cleared first – until then, it’s simply resting:
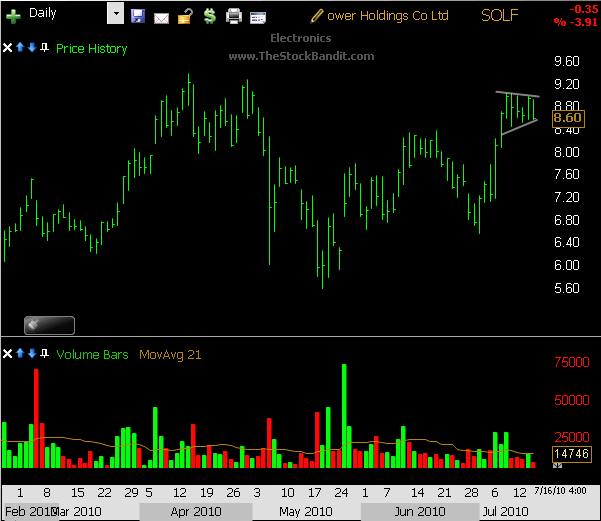
SOLF has been acting well, rising on strong volume in the past couple of weeks and basing here on quiet volume. An upside resolution to this bullish consolidation would technically be very positive:
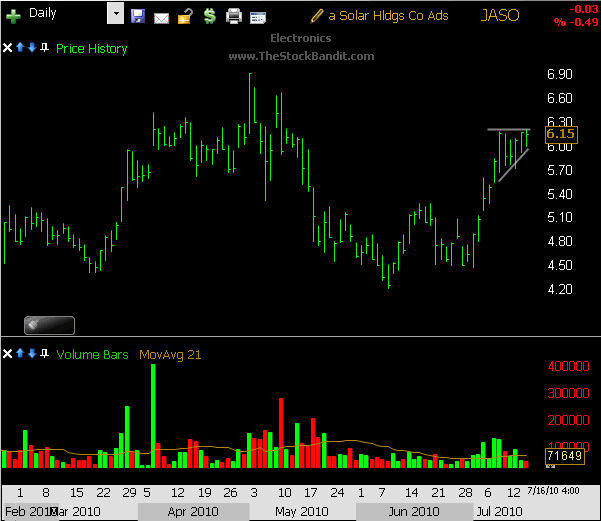
JASO jumped big from the July 1st low, confirming a short-term higher low and higher high. It’s been consolidating, and looks ready to challenge resistance:
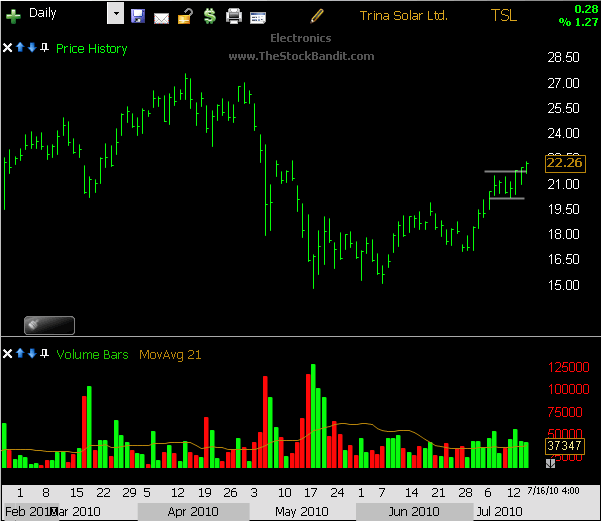
TSL is already on the move out of its consolidation after creating a higher low in recent weeks, but still has room to run:
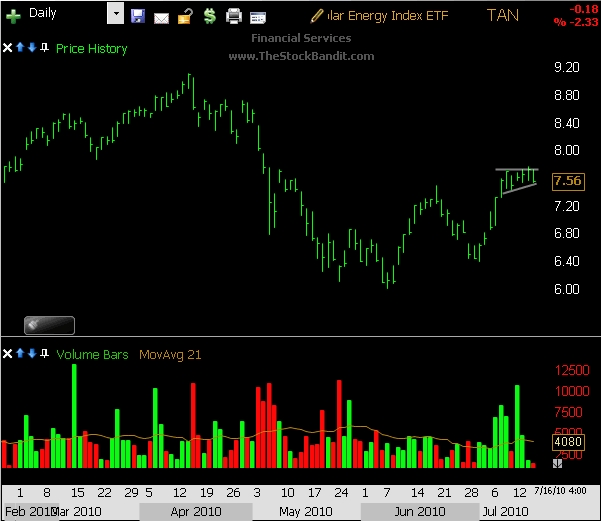
Even TAN, the solar ETF is looking good, so long as this bullish pattern gets confirmed with a move higher out of the consolidation. A higher low and a higher high have both been established:
Trade Like a Bandit!
Jeff White
Swing Trading & Day Trading Service
www.TheStockBandit.com
Are you following me on Twitter yet?
Technical Grade: F
June 22, 2010 at 7:09 am
Every chart should be given a grade, if for no other reason than it’ll require you to evaluate the entire situation and make a decision. Should it be traded? Should it be watched? Should it be avoided?
Looking at the chart of F below, this one earns an ‘F’ on recent behavior as well.
Have a MENT
June 21, 2010 at 6:49 am
Quick trades can be among the best kind, keeping capital tied up for a limited time and offering fast gains when they do their thing.
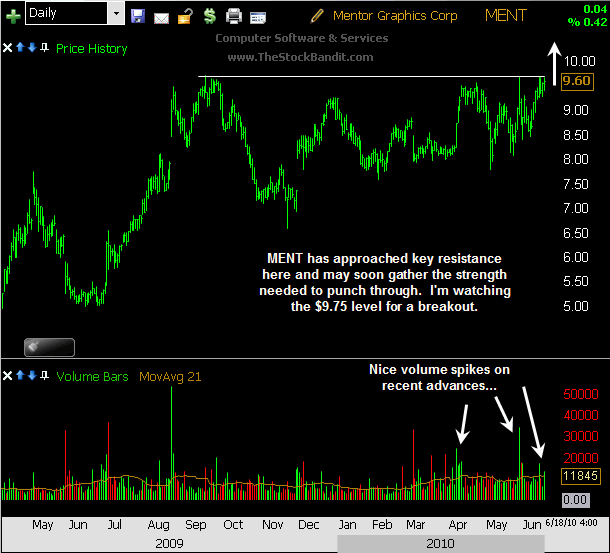
MENT is one I’m eyeing for such a trade. The stock has been quite active of late, moving all over the map within a $2 range for the past several months. Key resistance is now just overhead, and is being tested on the current bounce. Even better, volume has been spiking with advances of late, pointing to solid participation on the buy side.
We may see a breakout occur in MENT any day now, so I’ve got it on my radar for a trade if it can push through the $9.75 resistance area. This one hasn’t shown a lot of recent continuation, so it isn’t one I’m planning to keep a long time… Just long enough to get paid and move on to the next idea.
Here’s a closer look for you:
Trade Like a Bandit!
Jeff White
Swing Trading & Day Trading Service
www.TheStockBandit.com
Are you following me on Twitter yet?


