 All Entries in the "Chart Reviews" Category
Free Webinar Tuesday March 30
March 29, 2010 at 5:45 am
I wanted to be sure to post a quick announcement here that I’ll be presenting a Free Webinar on Tuesday (March 30th) with the folks from StockFinder, and I hope you can join us!
Targeting Trade Candidates with TheStockBandit
It’s scheduled to be a 45 minute webinar, the first 30 minutes of which I’ll be going through quite a few stocks of interest, pointing out to you what I’m seeing in the charts for both bullish and bearish candidates.
There will be 15 minutes of Q&A time at the end where you might want to bring forth your favorite stock and we can take a look at those too.
I certainly do not have all the answers, but it’s going to be a chance for me to convey what I’m seeing out there and hopefully not only teach you a few things, but also put many stocks on your radar which you might find interesting.
Oh, and the best part about it is that this event will be FREE, so be sure to register at this link for details (and access to the recorded version if you can’t attend live):
Chart Reading with TheStockBandit
Remember, free webinar this Tuesday night, 45 minutes of charting reading with you and me – I can’t wait!
Jeff White
President, The Stock Bandit, Inc.
Swing Trading & Day Trading Service
www.TheStockBandit.com
ANF Looking Vulnerable
January 19, 2010 at 7:25 am
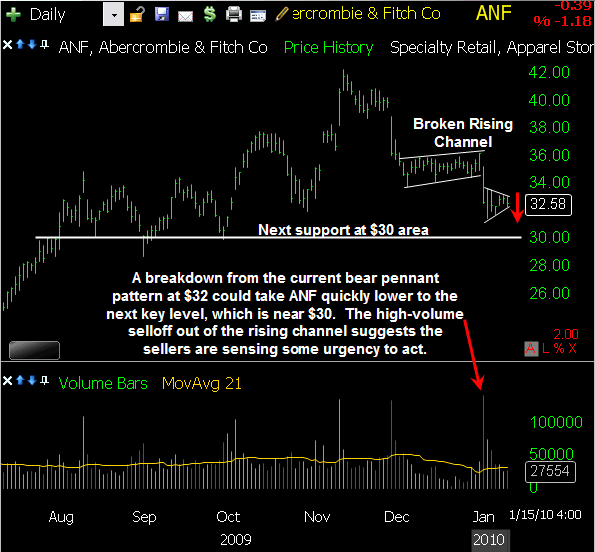
Anytime I see a stock crack support and fail to reclaim it, I pay attention. Especially when it makes no effort to rebound and merely consolidates after that key breakdown.
ANF is doing this right now. Just over a week ago, it undercut an ascending channel pattern on heavy volume, offering a decisive change of direction. Last week, not only did it fail to bounce, but it consolidated in a bear pennant pattern, indicating there may be more selling yet to come.
I’m keeping a close eye on this one, as a move down at $32 out of the short-term pennant would confirm this pattern, possibly leaving the $30 area as the next stop (given that it’s a former key level in the stock).
Here’s a closer look at the chart:
Trade Like a Bandit!
Jeff White
Are you following me on Twitter yet?
Is NFLX Leading Again?
January 12, 2010 at 7:46 am
With new highs being hit almost daily in the market, there has been an abundance of long-sided trade candidates. However, weak stocks are still in our midst, and it can serve us well to watch for those outliers – whether as individual profit vehicles or simply as hedges.
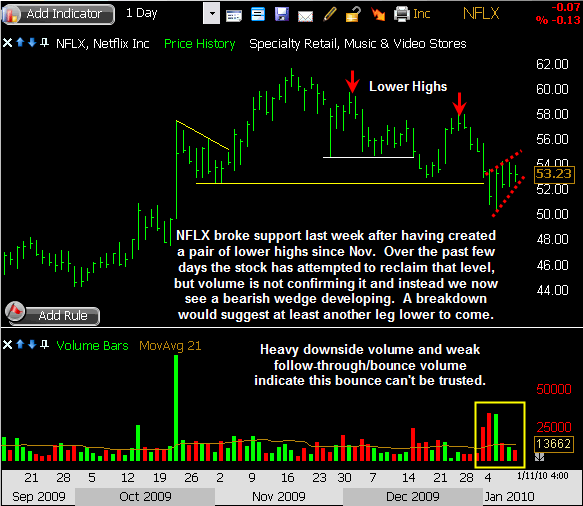
NFLX is one such stock. Not only did this one prove to be a market leader when it began trending higher a few months prior to the market turning the corner (NFLX in late 2008 vs. the market in March 2009), but it’s now trending lower while the market continues to climb.
A pair of lower highs has been established since November, and currently the stock is struggling to reclaim recently-broken support. The bounce of the past few days is now starting to create a rising wedge pattern which, if confirmed with a move back under the $52.50 area, could bring another breakdown for the stock. If it does, this one is on my radar for a play.
Here’s a closer look for you:
Trade Like a Bandit!
Jeff White
Are you following me on Twitter yet?
I See You PCU
January 11, 2010 at 7:26 am
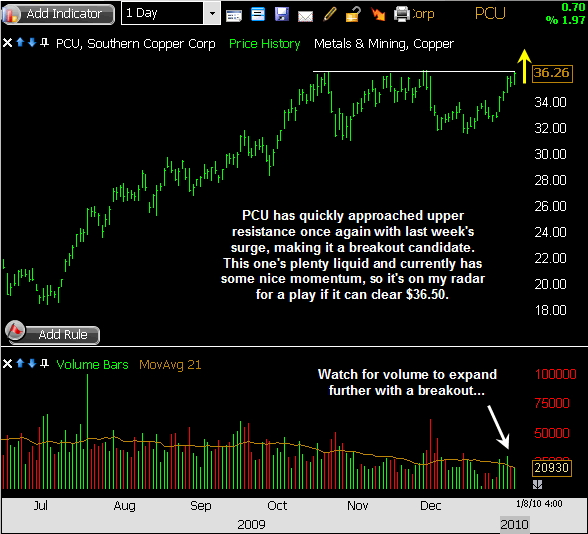
Strength in this market has been relentless, and that means many individual names are riding the wave. It can be difficult to work through robust watch lists in search of great plays, but often times it boils down to identifying the most valid levels, knowing if they’re violated that opportunity will emerge.
Last week, PCU “got on its horse” for several days and made a nice move right to upper resistance – a well-defined level it has flirted with several times in recent months. It’s now threatening a breakout, but will need to punch through the $36.50 level in order to pull it off. If it does, this one is on my radar for a play.
Here’s a closer look for you:
Trade Like a Bandit!
Jeff White
Are you following me on Twitter yet?
Nothing Wrong WIT This One
January 5, 2010 at 7:55 am
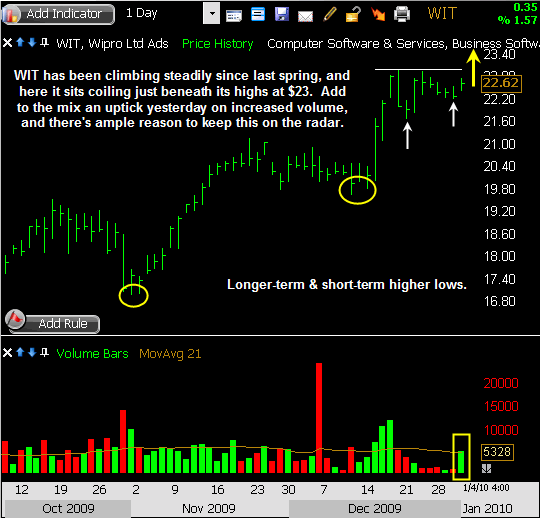
Solid technical setups often times will have more than one positive thing going for them. It may simply be having the market’s wind at its back, or it may be more like the stock I’m going to show you today. WIT has made a monster run since the March lows of 2009, tacking on about 350% since then. And while that’s a really impressive advance, the fact is that the stock is still trending higher – and may be poised for more.
Not only does this one have the long-term uptrend and higher lows/highs in place after that move, but even just over the past few weeks WIT has exhibited some great qualities. It popped big in mid-December on a surge in volume to make new highs, and since then it has put in some needed rest. We also see on the chart below a pair of white arrows highlighting short-term higher lows as the stock sits just shy of resistance.
On Monday, WIT turned higher on a pickup in volume, indicating we may soon see those highs get challenged at the $23 level. If so, this is one I’m definitely interested in, so it’s on my radar for a play.
Here’s a closer look for you:
Trade Like a Bandit!
Jeff White
Are you following me on Twitter yet?
LUV Still Adored
January 4, 2010 at 6:48 am
There’s a common desire among traders to “buy the dip” when given a chance, and I’m here today to show you one such opportunity. The idea of picking up stocks on even a minor discount within the context of a proven trend is indeed a good one – so let’s take a look at one chart of interest.
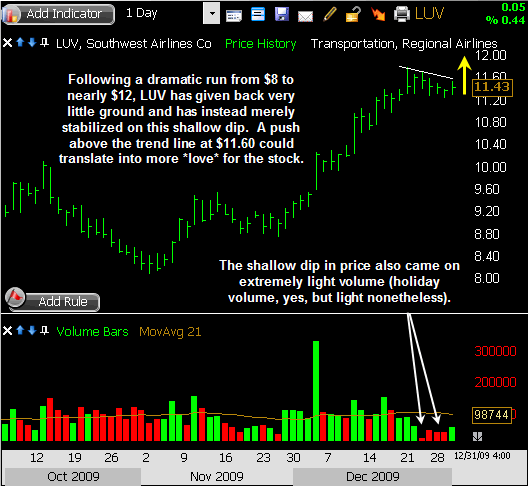
LUV, like many other airline stocks, has enjoyed quite a run over the past several weeks. The day to day action has been consistent, and although it hasn’t seen many huge individual days, the net result is an impressive 39% run over just the past 2 months. It may not be done either.
Even in the wake of the Christmas Day “underwear bomber” attempt (does that title ‘crack’ up anyone else the way it does me?), the stock saw only a very shallow decline before posting another gain to finish out the year.
The result of the dip has merely been some quiet consolidation on light volume, which has also created a small descending trend line just above current prices. A push north of that trend line at $11.60 could mean yet another takeoff for the stock (pardon the pun), so it’s on my radar for a play.
Here’s a closer look for you:
Trade Like a Bandit!
Jeff White
Are you following me on Twitter yet?
Eyeing Range Expansion in ACL
December 16, 2009 at 7:53 am
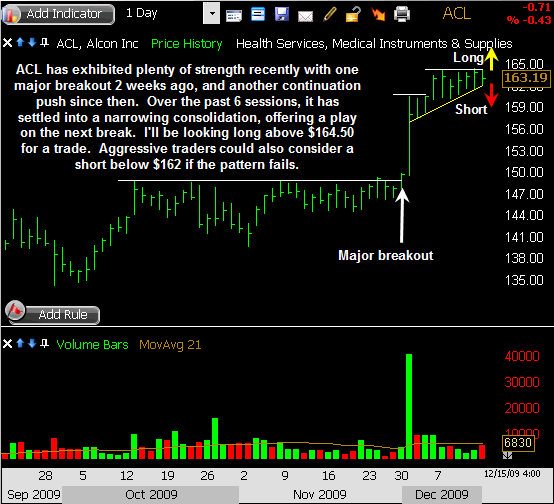
The ascending triangle pattern is commonly found within uptrending stocks, so in a bull market like we’ve been in since March, you can spot quite a few of them.
But just because it’s a bullish setup doesn’t mean the pattern will always pan out that way. In fact, I recently discussed pattern failures and the opportunities they can also deliver, so it pays to always stay on your toes.
I’ve been eyeing the chart of ACL in recent days with its ascending triangle pattern, and given the narrowness of the consolidation, this one looks like it’ll be resolved very soon.
Given that the trend is up, I’m on the lookout for continuation with a push through $164.50 as the next breakout level. However, this year I’ve seen a number of ascending triangle failures which offered some excellent signals, so it’s worth noting that if the lower (yellow) rising trend line gets broken at $162, it would be a short sell signal. Either way, this one looks ready for a decent move, so it’s on my radar for a trade.
Here’s a closer look for you:
Trade Like a Bandit!
Jeff White
Are you following me on Twitter yet?


