 All Entries in the "Chart Reviews" Category
Pattern Failures Are Worth Noting
December 8, 2009 at 2:44 pm
While the bulk of my trading revolves around chart patterns, and most notably the confirmation of them, failed patterns are certainly worth identifying.
Anytime a stock appears to be gearing up to make a move in one direction and suddenly goes the opposite direction, you can bet there are plenty of participants who are poorly positioned. Such is the case when patterns fail.
Obviously, the original plan goes out the window when a chart pattern fails, but that doesn’t mean you should turn your back on the stock. In fact, watching for plays to emerge in the new direction can often prove fruitful.
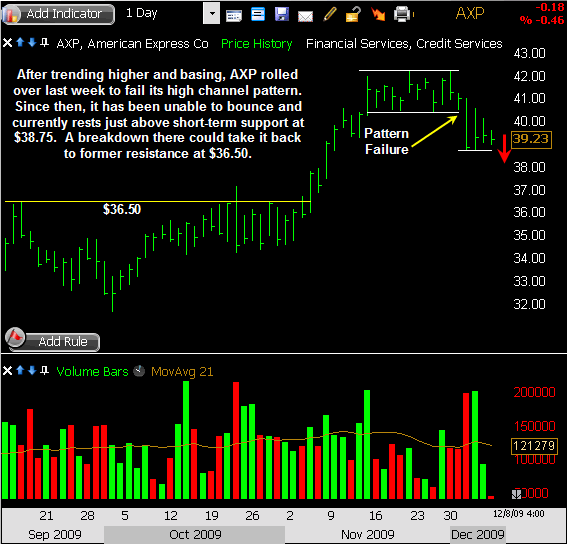
I just ran across an example that I wanted to point out to you. AXP had created a continuation pattern with a high channel following an uptrend, but price fell out of that channel last week to the downside. Now the stock is setting up for a possible secondary move downward, and it’s on my radar after seeing this chart today.
Here’s a look at it:
Trade Like a Bandit!
Jeff White
Are you following me on Twitter yet?
4 Cup & Handle Patterns to Watch
November 17, 2009 at 3:02 pm
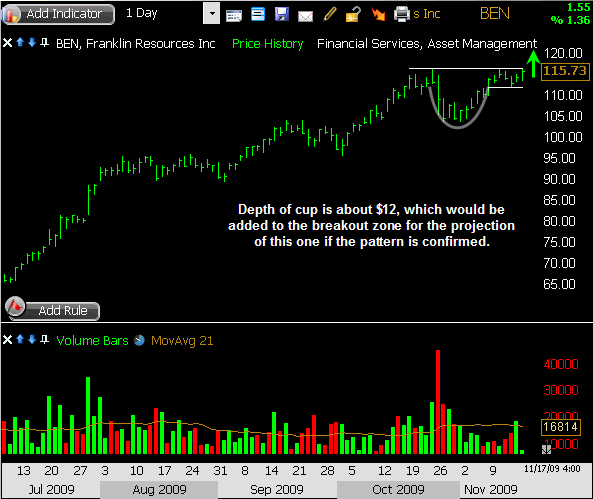
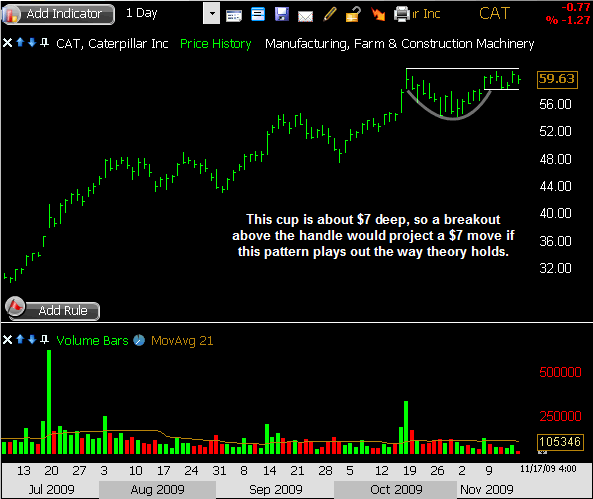
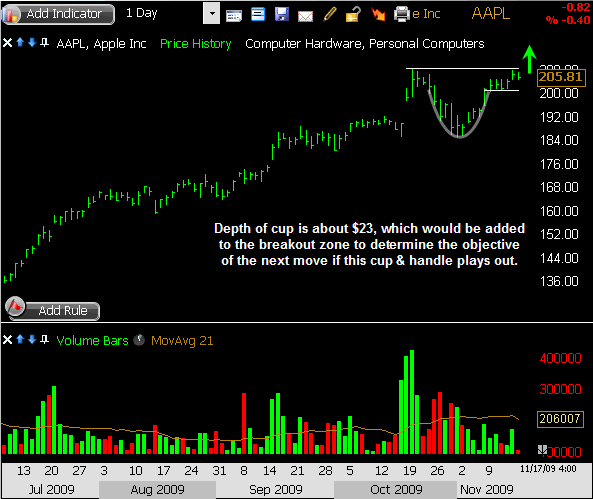
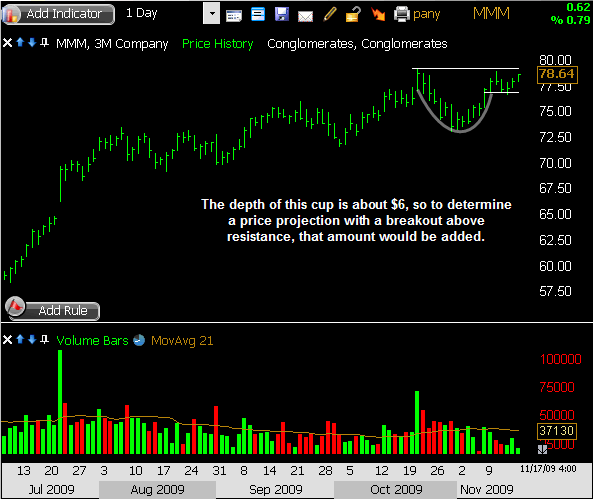
One of the most easily identifiable chart patterns is also one of the rarest – the cup and handle pattern. In this post, I want to show you a few which are developing right now.
The cup and handle pattern is sometimes misinterpreted, so let’s just review the basics…
First, this pattern must be found within the context of an uptrend. This is an upside continuation pattern, so the existing uptrend is a necessity.
Second, the height of the cup is important to note. This is the depth or distance from upper resistance to the low end of the cup, and it’s added to the breakout zone in order to determine a price target.
Third, a rounded cup is ideal. This suggests there were no sudden or sharp changes of direction, but merely a mild pullback and gradual recovery.
Finally, the handle portion will resemble a narrow channel, sometimes tilted downward, and may occur on light volume. This is the coiling action which will precede the breakout, and it gives the pattern not only recognition but also validity.
I just ran across a handful of examples that I wanted to point out to you. These are currently building their handles and may need more time to mature. The key is that this pattern is only confirmed upon a breakout, so that’s what I’ll be waiting for.
Trade Like a Bandit!
Jeff White
Are you following me on Twitter yet?
CVX Bull Flag Offers Potential
November 10, 2009 at 9:44 am
My nightly routine includes locating setups for tomorrow’s trading session, but I don’t want to stop there. Taking it one step further, I want to be aware of any other stocks which may be gearing up for moves in the days ahead – radar stocks, if you will.
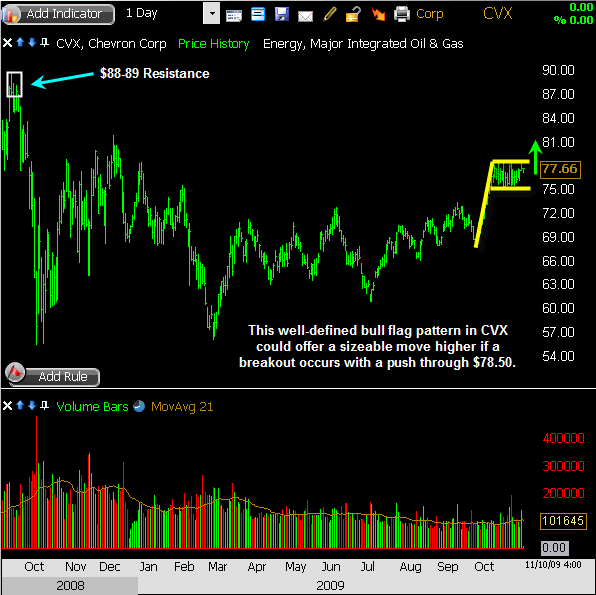
One setup that’s been on my radar for the past few days is CVX. The stock has trended steadily higher from the July low, and more sharply from the October low. Since then, it has settled into a very well-defined trading range over the past 3 1/2 weeks. The rally-and-base combination has built a very clean bull flag pattern, which offers not only a technical entry on a breakout but also an exit if that pattern should happen to fail.
I have no position here yet, but if this one clears $78.50 to break out from the bull flag, I’ll get real interested real fast.
A measured move could take this one on up to the $88-89 area, which would coincide with a resistance zone from August and September of 2008.
Here’s a closer look:
Trade Like a Bandit!
Jeff White
Are you following me on Twitter yet?
APOL Flirting with Breakdown from ‘h’ Pattern
November 6, 2009 at 11:01 am
Classic chart patterns still work quite well, and I trade them regularly, but they aren’t the only patterns out there to watch for.
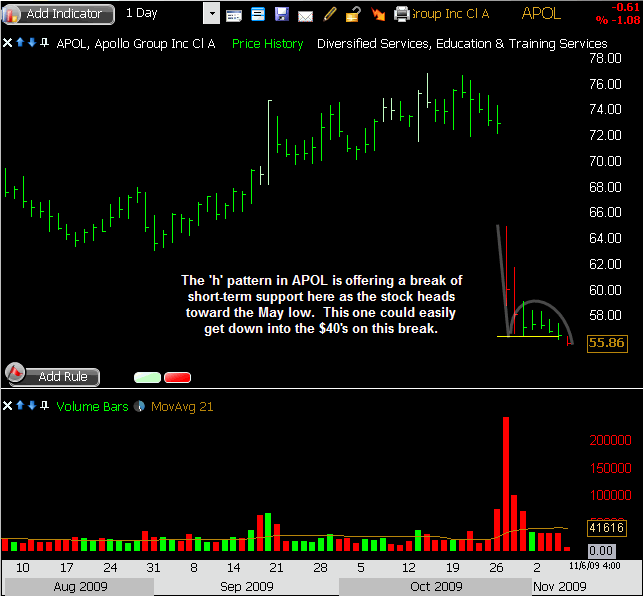
One pattern I’ve taken notice of in recent months is the ‘h’ pattern. This happens when a stock has a sudden or steep decline followed by a very quiet and weak bounce. The bounce begins to fail, and the price pattern resembles a lower-case h.
The way I trade the ‘h’ is to go short upon a break of the support level. It can offer an entry on the short side for a secondary move lower, and can carry a nice risk/reward profile with it.
APOL has this pattern right now and it’s starting to undercut support here. The stock has already been very weak since late-October, but it’s struggled to rebound. It bounced from the $55.35 level back in May, but below that the next stop could be in the $40’s.
Here’s one that’s worth a look.
Trade Like a Bandit!
Jeff White
Are you following me on Twitter yet?
Oversold Bounce or Higher Low?
October 29, 2009 at 9:51 pm
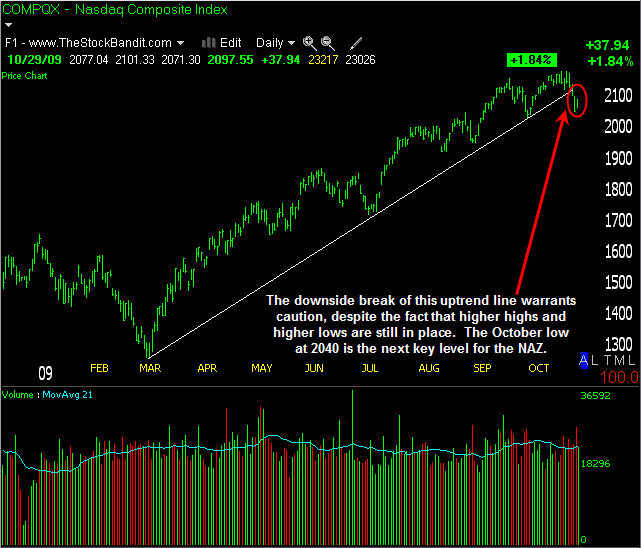
Following an impressive surge higher from early October, the market has finally taken a breather. The pullback of the past week has offered at least a short-term change of character that has my attention – and yours as well, I’m sure.
Downside follow through has been notably absent for some time now…until this week. Four consecutive declines began with last Friday’s reversal from the highs in the NAZ (2190), and ended with Wednesday’s punishing selloff. Thursday’s bounce was headlined by a near-200-point jump on the DJIA, but under the surface we saw the NAZ post an inside day. The S&P 500 erased Wednesday’s losses, but on declining volume. Mixed signals, to say the least.
Looking at the daily charts of the indexes, a case can be made for more than one scenario here. We are in well-defined uptrends, and the dip of the past week could again get bought and prove to be yet another higher relative low within the trend. But by the same token, the bounce we saw on Thursday could merely prove to be a relief rally after the harsh selling which put the market short-term oversold. It’s hard to place my entire weight on either scenario just yet, as more technical evidence needs to be seen to support one or the other.
So at this point, I’m making zero predictions. This isn’t a spot to buy blindly and bank on another rally straight back up to new highs. The selling intensity we just saw wasn’t like the modest pullbacks which preceded it. It was a little more vicious and a little more ominous. It could be the start of a change of character. And this isn’t a time to call for a market top and start shorting the daylights out of every name out there. The intermediate trend is still up, and that should be respected.
I’m expecting the next few days to carry some significance. Either the bulls prove themselves yet again, or the bears build on their newfound confidence and we see another leg down begin to develop. Personally, I don’t care which side wins out – I have no bias.
My approach is to stay very short-term for the next couple of sessions, day trading for quick moves in this increased volatility, and see what happens. Many stocks broke down hard and have the potential to construct bear flags and rising wedges if the rebound loses momentum and volume continues to sag. I’ll be watching those bounces intently. Other stocks still aren’t far from their highs, so I’ll observe them closely for signs of real strength returning – not simply a relief bounce of one day.
Both the bulls and bears have something to prove these next few sessions, so it could wind up being a pretty good battle. No matter what, volatility is picking up, and that’s a great thing for us as traders.
So stay objective out there, anything is possible. Expect surprises in both directions. We’re getting into the best season for trading in the next several months, and I’m excited about it!
Trade Like a Bandit!
Jeff White
Are you following me on Twitter yet?
Why I’m Not Trading AAPL
October 19, 2009 at 10:27 am
AAPL is set to report earnings after today’s closing bell. It’ll be the focus of attention at times both today and tomorrow as the dust settles post-news, but truth be told, I have no interest either way.
Obviously it’s one of my trading rules to avoid stocks when they’re reporting earnings, as scheduled fundamental news simply carries with it no edge for me as a technical trader.
But I’ve had no interest in trading AAPL for a few months now. Let me explain why.
The short answer is that AAPL simply doesn’t move enough. For a stock that’s highly liquid (over 15 million shares/day on average) and within sneezing distance of $200, it should move a lot. And yet it doesn’t. On an average day, it’ll see an Average True Range (ATR) of about $3. There are stocks trading at a fraction of AAPL’s price which move that much and are still highly liquid, so why pay up for less movement?
Let’s take a look at the chart.
Over the past year, we’ve seen AAPL’s price rise dramatically, while its movement has shrunken dramatically. ATR is a price-based measurement (not percent), so as price gets higher and higher, often times we’ll see ATR expand along with that. That’s not the case with this stock.
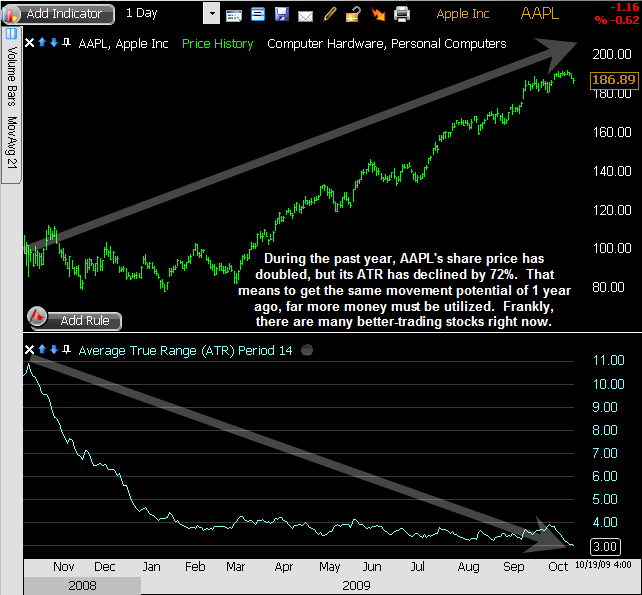
StockFinder Chart courtesy of Worden
Anytime you’re trading the high-priced stocks, do your best to gauge whether there’s enough movement there on an average day to justify an entry. Others like GOOG, CME, and BIDU all are higher-priced than AAPL, but on a relative basis (when comparing ATR) they each move considerably more than AAPL.
At some point, AAPL will be worth trading again, but on an average day right now, the moves are just too limited to warrant an entry.
Thanks for stopping by and I’ll see you here soon with more. Until then…
Trade Like a Bandit!
Jeff White
Are you following me on Twitter yet?
Understanding the Quiet Rally
September 23, 2009 at 8:32 am
It’s been one impressive rally…by some measures. The indexes have made an about-face from the March lows, refusing to look back as they erase so much of the carnage of the bear market. The move has been persistent and consistent…just a ton of green days.
But very few big days. Have you noticed?
I’ve been amazed at the lack of volatility, especially recently. It seems a huge day for the DJIA has become a triple-digit net change from the prior day’s closing levels. Just a few months ago, we were getting gaps that big to start the day, nevermind the several-hundred-point moves which were commonplace. Needless to say, it has indeed become a quiet rally.
In order to understand it a bit better though, I turned to an indicator to help make sense of it all, and I was surprised at what I found.
Different Directions
In the video below, I’ll walk you through my thought process that led me to doing this, and of course I’ll explain what it is that I discovered. Of equal importance, you’ll understand how and why navigating this market for as long as this rally runs its course will require a different approach than what is ‘typical’ (if there is such a thing in the market).
Here’s a video explaining it. Select the HD option and go full-screen for best quality:
Thanks for stopping by and I’ll see you here soon with more. Until then…
Trade Like a Bandit!
Jeff White
Are you following me on Twitter yet?


