 All Entries in the "Chart Reviews" Category
Multiple Timeframe Charting
October 23, 2006 at 8:15 am
I often run across a stock with a tradable pattern, but a second look will often change my mind.
This week I ran across SVU, a stock which has been rallying steadily since August. More recently, it had a breakaway gap to the upside and has since consolidated to create a very nice bull flag pattern. Here’s the chart:
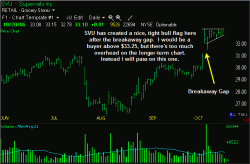 (Click for full size.) Chart Courtesy of TeleChart.
Ordinarily, I would be a buyer of a stock like this upon an upside breakout from this tight pattern at $33.25. However, zooming out to a longer timeframe reveals quite a bit of resistance from the past 2 years in the $34-35 range which could make a breakout somewhat short-lived as the stock encounters overhead. Here’s a longer-range chart:
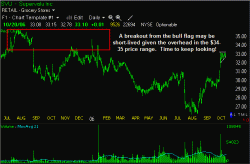 (Click for full size). Chart Courtesy of TeleChart.
Previous highs mark places where sellers are lurking, and staying aware of such zones can often help you select better trades to take.
There are a lot of stocks out there to trade, so there’s no need to be married to any particular one of them. At TheStockBandit.com, we do the heavy lifting for you by reviewing hundreds & hundreds of stocks every night to cherry-pick the best setups. If you want to save some time locating the highest-quality chart patterns, come trade with us!
Jeff White
President, The Stock Bandit, Inc.
www.TheStockBandit.com
By the way, subscribing to this RSS feed will mean you won’t ever miss a post!
5 IPO’s and How to Trade Them
October 18, 2006 at 12:53 pm
Earlier this week in the Free Newsletter (sign up in the sidebar at TheStockBandit.com) we discussed trading IPO’s, but let’s go a little deeper.
IPO’s are making a comeback these days in the market. With the indexes climbing steadily higher, new issues are garnering attention as sexy trading vehicles once again. Back in the day, trading IPO’s was a wild ride which everyone wanted in on. The trading world was fully aware of what was due to begin trading on a given day, and you were sure to find some heavy action in those stocks once they opened and for the first few days of trading.
Times have changed, and so have the ways which IPO’s are being traded. It’s a given that today’s IPO’s are a far cry from those of 1999 and early 2000, so naturally that means they require different trading methods.
I’m a big proponent of monitoring the “personality” of stocks before I trade them. How else can you set your expectations for how a stock will move, where to place your stops, and how aggressively to trade them?
There are still some great moves out there taking place in IPO’s, but generally I’m finding the best moves are secondary rather than the primary (or initial) move.
The way we trade IPO’s at TheStockBandit.com is to let them make their initial moves, settle down a bit, and get set up for a secondary move. I like to see IPO’s trade for a few days so that I can get a feel for how they’re moving and what kind of volume they have (what is the overall interest in this stock?) and then take them for a trade on a secondary move.
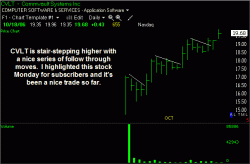
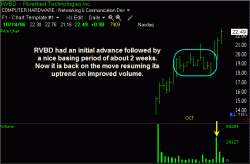
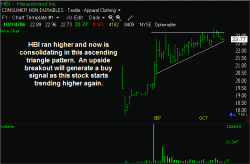
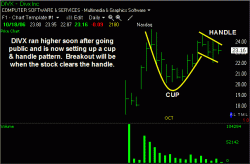
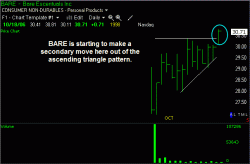
Many IPO’s will have some initial excitement and then begin to consolidate. Volume falls off and the stock moves horizontally, creating a base from which a secondary move can launch. The majority of the time these bases come in the form of a bull flag pattern, a cup and handle pattern or a bullish ascending triangle, and that makes it very clear what the pivot point should be for getting long. Let’s look at a few examples of IPO’s which fit the description.
There are a ton of ways to profit in the market, and swing trading IPO’s as they emerge from traditional chart patterns is one of them. We trade some of these at TheStockBandit.com, and even if you’re on the free trial I’ll show you what I’m seeing in the charts and outline my trade parameters along the way. If they fail, my bail out will be close by thanks to the pattern, so it’s no big deal. And if they work, well it’s blue sky above and there’s no telling how far they might run!
Jeff White
President, The Stock Bandit, Inc.
www.TheStockBandit.com
By the way, subscribing to this RSS feed will mean you won’t ever miss a post!
Gotta Love Second Chances
August 7, 2006 at 4:42 pm
Second chances are so nice to get, even if we don’t deserve them! If you pay attention in this choppy market environment, you’ll often find that you get multiple chances to get into a trade (and profit).
This could be viewed as frustrating, as a stock breaks down or breaks out, only to quickly return to the support or resistance level. However, it can be great if you get caught snoozing on the first move!
Last night in my stock newsletter, I highlighted NTRI as a potential short. NTRI had broken down a couple of weeks ago and since then had formed a bear pennant pattern. A break below $51.00 at the lower trend line was the trigger for my short sale.
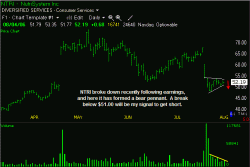 (Click image for full size) NTRI was primed and ready to break down from this bear pennant pattern, with the trigger being a break of the lower trend line at $51.00.
 NTRI triggered soon after the open today and I was able to short sell it as it broke through the $51.00 level (thank you ARCA market sell/short!). Had I missed the first entry, I would have had another shot at getting in the trade by offering into the first bounce which carried it right back up to the $51.00 level (funny how that works!).
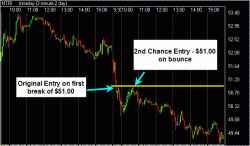 (Click image for full size) NTRI broke the $51.00 level right off the open, but the bounce which followed provided another shot at entering this trade. Gotta love those second chances!
 Fortunately, NTRI drifted lower throughout the day, providing a nice trade whether you caught the first or second entry. In fact, if you don’t like to trade breakouts/breakdowns, you may actually prefer to bid into pullbacks or offer into bounces in order to establish a position – if so, this is an excellent market for you. Be on the lookout for second chance entries in these choppy conditions, and you’re sure to find some second chances to profit!
Jeff White
President, The Stock Bandit, Inc.
www.TheStockBandit.com
By the way, subscribing to this RSS feed will mean you won’t ever miss a post!
[tags]Stocks, Investing, Stock Trading, Short Sell, Trading[/tags]
The Other Side of Discipline
May 14, 2006 at 11:24 pm
The “D” Word is for both sides of a trade.
While taking small losses is widely accepted as the way to survive in trading, good discipline will serve you well on the profitable side of a trade too.
TGB is a little stock which just gave us a huge upside pop in spite of it’s low share price. I recently listed this small gold stock in the “Momentum Movers” portion of The Bandit Broadcast stock newsletter with a buy point of $3.50.
Keep it Rolling
April 5, 2006 at 9:04 pm
It’s no secret that the fastest way to compound your money is to keep it working for you. For that reason, when I’m in the market, I do my best to keep my trading capital at work in stocks that are on the move. I lose patience quickly in trades that stall out, because I know there’s opportunity elsewhere I ought to be capturing. So when a stock begins to lose steam, I raise my stops aggressively so that if the trade begins to flutter, I am checked out of the stock and am free to put my money to work elsewhere.
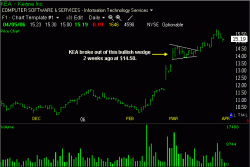 KEA worked for a little while, but once it slowed down I raised stops aggressively. When stocks slow down, there is opportunity elsewhere to capture.
Today I was stopped out of KEA (Keane Inc.), but with a gain. I highlighted this stock as a swing trading candidate in my stock newsletter 2 weeks ago with a buy point of $14.50. KEA quickly began to work, showing me a gain of 9.5% in just 8 days. I raised my stop on Sunday night, and on Monday this stock began to fizzle out. With the market on the verge of a breakout, I was in no mood to stick with this trade, knowing that there would be a number of other opportunities I could catch if KEA was going to stall out. Today, I was stopped out at the close.
Getting stopped out doesn’t bother me, for a few reasons:
1) I booked a winning trade of 4.5% in 2 weeks. Not stellar, but not bad either.
2) I like to keep my money rotating into new stocks with potential, rather than sticking with a stock that is no longer on the move in my direction.
3) I now have more cash on hand to put into new setups which I highlighted tonight in the Member Area.
Force your trades to continue showing you why you should keep them on your screen. When your trading capital is at work, expect a lot from it. Whenever your positions stop producing profits for you, it’s time to move on to something else that will.
By keeping your money rolling from one good trade to the next, you’ll be able to rack up returns that would make the buy-and-hold crowd blush.
Jeff White
President, The Stock Bandit, Inc.
www.TheStockBandit.com
Too Thin to Win
March 27, 2006 at 8:07 am
Although I’m a big proponent of trading with the use of chart patterns, a stock’s volume simply cannot be ignored.
I run across literally thousands of stocks every day in search of not only the best technical setups, but also the proper conditions under which to trade those stocks. I ultimately locate the cream of the crop for subscribers of my stock newsletter, and it results in consistently profitable trading.
There are many stocks which come through the scans with “the right look” to them, but a closer examination reveals some glaring reasons to avoid the stock as a potential trade. The most common reason pertains to volume, and particularly the risks associated with low volume.
Volume is the total number of shares traded for a given timeframe. It is a measure of liquidity for a stock, because it represents participation. High volume makes for a more competitive market with narrower spreads and more consistent price action. Low volume, however, is a warning sign to move on to the next trading idea.
Low volume stocks should not be trusted for several reasons:
Low volume means low participation. If very few people are active in a stock, then what appeal does the stock have? If participation remains low, that stock may simply sit idle while you have your cash parked in it, leaving you with fewer opportunities for profits.
Additionally, a stock with very low volume will often trade with a wide spread, which increases slippage when entering and exiting trades. Trading is hard enough without handicapping yourself with more difficult executions!
It is also far more difficult to accurately read the price action in a stock which might only trade every 10 to 15 minutes during the day. When a stock only trades 25,000 shares a day, what defines a big seller? 2000 shares? What defines momentum? A 20-cent move? It isn’t worth it.
And finally, a low-volume stock can be awfully hard to get out of if the tide turns against you and you need to get out. When the music stops and you need a chair, it’s going to be extremely competitive to get a good price when you go to sell your stock, which makes your losing trade even worse.
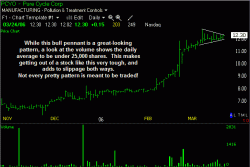
Let’s look at an example. PCYO showed up this weekend on my scans as having “the right look” to it. However, one glance at volume was all it took to see that this stock is too thinly traded for my liking. This stock averages fewer than 25,000 shares a day, which is entirely too light no matter how good the pattern might be.
PCYO has a very nice bullish consolidation which can easily be seen with the converging trend lines on the chart shown above, but this stock has hardly anyone trading it! This stock may take off and run higher, but the risk associated with the low volume of this stock tells me I would be far better off finding something else to trade.
When you screen for chart patterns, be sure to include volume in your requirements for potential trades. Just because the chart looks pretty doesn’t mean that stock should be traded. With literally thousands of stocks out there to trade, be strict with your criteria and put the odds in your favor every chance you get. Or, become a member at TheStockBandit.com and let us do the work for you!
Jeff White
President, The Stock Bandit, Inc.
www.TheStockBandit.com
I Love A Good Deal!
March 20, 2006 at 2:18 pm
This is an excellent dip-buying market, but you’ve got to know how to do it right if you want your trade to be a winner!
The idea of buying stocks on a dip sounds nice, but it isn’t easy to put into practice. Some people think that buying a stock on a dip means that any weakness should be bought. Well, what defines a dip? It depends on the timeframe! When do you know that a stock has finished “dipping” and is now ready to turn higher? Should every purchase be made on a dip?
My standpoint (and that of TheStockBandit.com) is not to buy any stock just because it looks “cheap.” Buying a stock simply because it’s at a lower price than it once was is never a reason to buy in my opinion. Maybe you can shop on the weekends that way, but in the trading world, you’ll often pay dearly when you buy weakness. I wouldn’t buy a stock that just got pounded, even if it is much cheaper than it’s ever been. In fact, you’d probably be far better off short selling a stock on a 52-week low than buying it.
The only time to buy a stock is when you think it’s going higher.
Having said that, the only time it makes sense to buy a stock on the dip is when it’s in the middle of an uptrend! During an uptrend, a dip is merely a pullback which sets up a new pivot point for buying. What’s also nice is that pullbacks within uptrends also produce natural stop-loss areas which let you manage your trade much better than buying blindly. So, let’s see an example of what buying a pullback looks like.
Last night, BWNG popped up on my scans as an uptrending stock that appeared to be completing a pullback within the trend. The stock had great recent momentum and had pulled back slightly off the highs but mostly was moving sideways. A well-defined trend line was seen along the highs of the past couple of weeks, which provided us with an excellent swing trading pivot point. I highlighted BWNG in my stock newsletter last night with a $13.00 buy point.
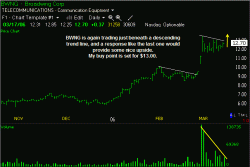 BWNG is in a well-defined uptrend, and the minor pullback presented an excellent buying opportunity for us at TheStockBandit.com this morning when it cleared $13.00.
….. and so far this stock is rocking to the tune of more than 11%….
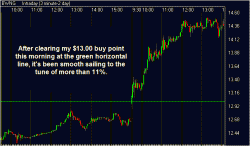 BWNG has been smooth sailing since it triggered our $13.00 buy point this morning, giving us a very nice (and quick) profit of 11% and counting.
When you commit to buying the dips, be sure you’re doing so when there is an uptrend intact! Don’t buy a downtrending stock that will leave you feeling more like a stuckholder than a stockholder. Buying pullbacks within uptrends can give you a great initial move and put your trade well into the black right from the start!
Jeff White
President, The Stock Bandit, Inc.
www.TheStockBandit.com


