 All Entries in the "Chart Reviews" Category
Parabolic Uptrend: IIIN
March 7, 2006 at 9:17 am
Some stocks on the move are simply best avoided.
We’ve looked at MOVI twice (December 6th and February 13th) as a downtrending stock to avoid. Cheap stocks can be tough to short sell because they don’t move very much and they become more ripe for takeovers, which you sure don’t want to get caught on the wrong side of!
But sometimes stocks move up at such a rate that they too are best avoided. Anytime a stock is running higher at a rate which is not sustainable, it’s probably best to just observe and wait for a good chart pattern to develop before entry.
One such stock is IIIN. This stock has now moved higher an incredible 17 sessions in a row, moving up by over 44% during that time! This is called a parabolic uptrend, and although it often will be the way a stock ends its advance, it is extremely difficult to trade. For one reason, the stock has advanced so far that it’s tough to buy it with any confidence. Secondly, when the music stops, you can bet that everyone’s going to start looking for a chair and the stock could surrender lots of ground quickly in search of bids at a lower price. This makes a stock like IIIN hard to buy or go short in.
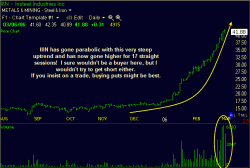 IIIN is on a tear, but I wouldn’t want to be a buyer here. Buying puts would be my only consideration, because trying to short a stock like this can be like stepping in front of a freight train!
Always consider the emotions of other traders in a stock like this. The ones who are short desperately need to cover, and the ones who are long are tempted to take profits. Such emotions in a stock like IIIN after an extreme move will surely keep things tricky! If you must dip a toe in the water, be careful with this one. Puts might be the only thing to buy related to IIIN, but avoidance is probably best for now.
Jeff White
President, The Stock Bandit, Inc.
www.TheStockBandit.com
Trend Line Extensions
February 28, 2006 at 4:46 pm
Trend lines are a key element of chart patterns and technical analysis. While the most common use of trend lines is to connect consecutive highs or lows, the extensions of trend lines can often prove to be valid.
On Sunday night in my stock newsletter, I highlighted ESCL as a short selling candidate due to the rising channel the stock was trading in. This channel was easily seen on the chart. The lower trend line obviously connected the recent lows, but the upper trend line was different. Not only did it connect the recent highs, but it was an extension of the trend line which connected a series of lows back in late January.
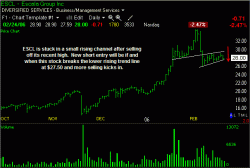 ESCL’s rising channel was created by the upper trend line extension and the trend line connecting the recent lows. Our short entry was at $27.50.
On Monday, ESCL triggered when it hit our short entry price of $27.50 and began to break the lower trend line. This was at the beginning of the day, and the stock finished the day higher, taking us out of the trade at the end of the day with a small $0.40 loss. On Tuesday, however, the stock re-triggered when it broke $27.50 to the downside, and this time it worked quite nicely, giving members at TheStockBandit.com a quick 10% winner and yet another trade to smile about!
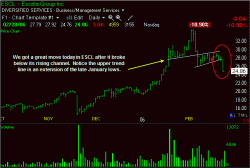 ESCL broke support at $27.50 today for the 2nd time and gave us an excellent move for our short sale.
We have a disciplined trading strategy and we’ll give a good setup like ESCL a second chance to work. Our winning trades far outshine our losing trades, providing ample trading profits for us on a regular basis.
Why not stop by and take your FREE trial to our stock newsletter and see how we make our living swing trading?
Jeff White
President, The Stock Bandit, Inc.
www.TheStockBandit.com
What a Short Squeeze Looks Like
February 27, 2006 at 10:30 pm
Short selling can generate some nice profits….quickly. Maybe that’s why the word short is used – because it can be such a quick trade.
I noticed OPMR this afternoon and cringed for those traders caught on the wrong side of a short squeeze. This stock had been moving steadily lower and had even confirmed a couple of chart patterns along the way. However, trying to swing trade a stock so badly beaten up on the short side can be tricky, so be sure that you pay attention when you’re short.
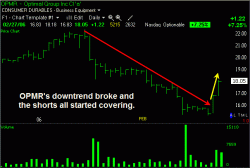 OPMR had been moving steadily lower before the trade got crowded and the path of least resistance suddenly changed.
A short squeeze occurs when a downtrending stock suddenly catches a bid and begins to rise. The traders who have short positions begin to see their trading profits slip away, causing them to panic and buy to cover their shorts. This quickly pushes prices higher, and upside momentum replaces the downtrend due to the sudden burst of buying. One look at this 2-day chart of OPMR and it’s easy to see that plenty of traders got caught on the wrong side.
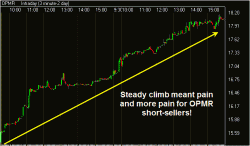 Once OPMR changed directions, it was smooth sailing to the upside with shorts covering for the past 2 days.
Uptrending stocks will occasionally be met with a heavy dose of selling, seemingly out of nowhere. This is the same kind of behavior that leads to short squeezes, and is characterized by a large group of traders reacting to a shift in a stock’s direction.
Short selling is not a poor trading method, so there’s nothing to be afraid of. As long as you keep your stop loss in place and remain disciplined, you can avoid getting caught in a short squeeze. Just don’t ever underestimate the level of pain in a stock when you’re trading the short side, and be quick to take profits when the landscape begins to change!
Add another dimension to your trading and watch how I trade the short side with a 2-week FREE TRIAL to my stock newsletter.
Jeff White
President, The Stock Bandit, Inc.
www.TheStockBandit.com
Day Trading Headlines
February 16, 2006 at 4:18 pm
Anytime headlines come out on a stock you’re trading, you’ll probably know it. Today I was long CHNR when a negative headline hit and this stock changed character quickly. When that happens, it’s best to remember the day trader’s motto: “sell now and ask questions later!” With commissions so cheap these days for direct access trading, it’s usually better to be safe than sorry when it comes to headlines.
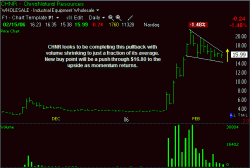
I had highlighted CHNR as a long candidate in my stock newsletter last night with a buy point of $16.80. This momentum stock had settled into a powerful bull pennant pattern, and an upside breakout was the swing trading buy point.
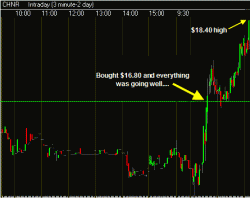
Today, CHNR caught a bid during the morning and quickly advanced, hitting my buy point and moving higher by another 9.5% in just 2 hours time. With a nice profit on my screen in such a short amount of time, I took partial profits on the way up and had planned to ride the rest as a swing trade position.
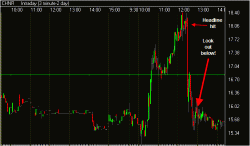
During lunchtime, however, a headline hit the wires which was picked up by my news feed that CHNR would have to seek continued listing by filing a new listing application with Nasdaq. This was major news, and the stock began to react in a hurry. My ticker went solid red and I knew it was time to take my remaining profits now that the landscape had changed so drastically. While I don’t mind giving an active stock some room to move, it was the fact that a significant headline had come out that caused me to sell.
Keep a close eye on trades even when they are working! Don’t be afraid to take partial profits into unusual strength to book some gains, and be willing to walk away if fundamental news surfaces. The market doesn’t always act rationally, because traders will almost always sell now and ask questions later.
Jeff White
President, The Stock Bandit, Inc.
thestockbandit@thestockbandit.com
Still Ugly!
February 13, 2006 at 8:14 am

"Look away, I'm hideous!"
Back on December 6th, I gave a chart review of MOVI, which was a downtrending stock. The point of the article was to avoid downtrending stocks.
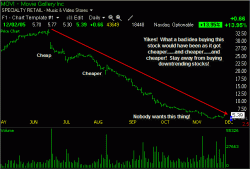
Although MOVI appeared “cheap” at that time, lower highs and lower lows were in place and there was no reason to believe that was about to change. Here’s a look at the chart I showed back in December:
MOVI put in some horizontal price action following my post, but that was merely a pause in the poor action. Trends followed by horizontal price movement are often followed by more trending in the original direction, which is what MOVI is still doing.
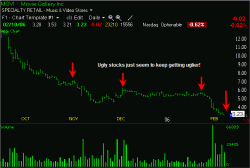 MOVI is down another 40% since I reviewed it within its downtrend, which certainly counts as hideous!
This stock is once again moving lower (down 40% since my review of it – ouchie!) and getting “cheaper” for those who believe in the stock’s fundamentals. Imagine their pain!
The moral of the story is still the same: stick with the technicals and avoid buying stocks in downtrends. Make sure that a stock you’re considering buying has some potential to rise in price and make a higher low and a higher high. Don’t let today’s prices compared to historical prices be your basis for buying a stock, because cheap stocks only seem to get cheaper. You’ll save yourself a lot of money and be able to focus on good opportunities instead of babysitting trades resulting from poor decisions.
Jeff White
President, The Stock Bandit, Inc.
www.TheStockBandit.com
Watch Trades for Clues
February 6, 2006 at 8:50 am
Some trades are profitable while still offering us clues as to just how well they are working. While our primary objective is to turn a profit with our trades, it is certainly important to monitor the behavior of our trades to do our best to determine what we should expect going forward.
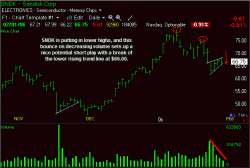
I highlighted SNDK in my stock newsletter on Wednesday night with lower highs in place and a bear flag pattern which had subsequently formed. The short selling entry point was a downside break of $66.00 at the lower line.
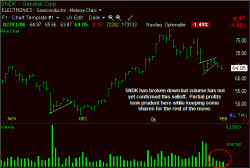
The following day, SNDK triggered and showed us $0.98 in profits. On Friday, it dropped another $0.97 for us, showing us a total profit per share of $1.95 from our short entry.
While I do like the fact that this short sale trade is working, I am a bit concerned by HOW it is working. Although beggars can’t be choosers, I would much prefer to have seen volume kick in with higher levels on Thursday or Friday to indicate intense selling in SNDK as it confirmed the bear flag. So far, we’ve gotten profits but it looks a bit iffy to me. As a result, I’ll plan to take partial profits to lighten up on shares in case this stock bounces. Doing so will prevent me from giving back full profits, while at the same time allowing me to stay in the trade if a larger move develops. Perhaps soon SNDK can find greater downside volume, but it’s important to operate with the facts we are given as traders, so I’m turning slightly cautious on this trade which is working but not technically sound.
Jeff White
President, The Stock Bandit, Inc.
thestockbandit@thestockbandit.com
What A Breakout Looks Like
January 24, 2006 at 5:14 pm
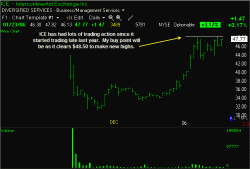
Last night in my stock newsletter, I highlighted ICE for a swing trading candidate on the long side if it could make new highs at $48.50. Here’s the chart I showed in last night’s newsletter:
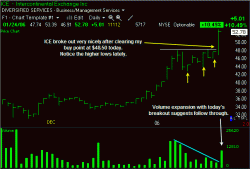
I particularly liked the recent volatility following this stock’s uptrend, along with the fact that this stock was testing the recent highs. Throw into the mix that ICE has been making higher lows in the past couple of weeks, and the ingredients of a good setup were complete. A break above the horizontal line was the entry point I showed to my subscribers, and today ICE raced higher all day long, adding more than 10% to show us a gain of more than $4.00 per share!
Here’s a look at the ICE chart after today, with the breakout very easily seen:
Don’t be afraid of trading the new issues like ICE. Just because a stock has less trading history than many others out there doesn’t mean that you can’t catch a great move out of quality chart patterns!
To catch moves like this with me instead of hearing about them from me, sign up for your 2-week free trial to my stock pick service!
Jeff White
President, The Stock Bandit, Inc.
www.TheStockBandit.com


