 All Entries in the "Chart Reviews" Category
Confirmed Trend Change for VZ
August 29, 2012 at 10:21 am
The double top pattern – like the double bottom pattern – is over-diagnosed. Anytime a stock challenges a previous high, the amateur technician jumps at the chance to declare a double top in the making. And generally they’re premature in doing so.
But the professional takes a different approach.
Rather than seeking to be the first to recognize a trend shift, it’s better to wait for confirmation of that change to come along. And in the case of the double top pattern, that requires a break of the reaction low or pullback low which was established between the peaks.
A stock fitting this description right now is VZ, which just confirmed not only a double top but has also offered an additional layer of importance by failing to reclaim former support on the bounce.
One other note is to take a look at the 2nd high on the chart on Aug 1. Price touched the previous high to the penny (not a requirement for a double top, by the way) and failed to clear it, but something else happened which was noteworthy: the finish for that day was much weaker than the day when it initially marked a high (July 18). This is another thing to watch for which might offer clues that a stock is perhaps running out of steam and deserves a closer look going forward in anticipation of a potential trend change.
Going forward for VZ, the path of least resistance is down, at least until the $43.40 area (lateral support/resistance) is reclaimed on a closing basis. That’s the level which can now be traded against. The stock looks to have next support around $41, which was a level of importance back in May.
Here’s a closer look at the chart of VZ for you:
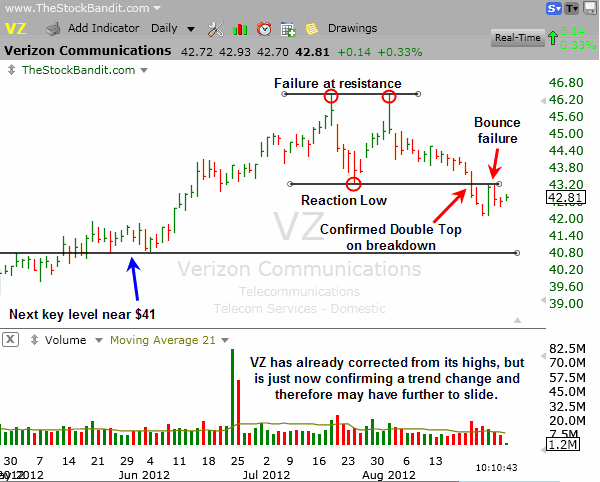
Be careful jumping to conclusions about double tops or bottoms. Instead, be patient enough to wait for confirmation of a trend change so you can trade with greater confidence of the direction.
Trade Like a Bandit!
Jeff White
Subscribe to our Stock Pick Service to get our trades.
Up 10 of 11, SPY Still Not Extended
August 20, 2012 at 9:24 am
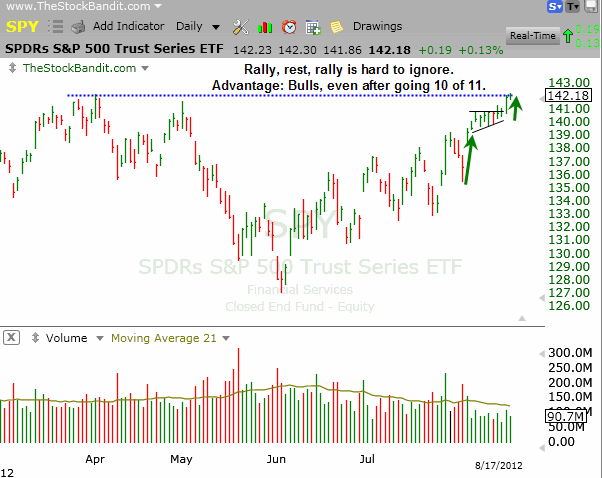
SPY has made a nice run since early August when a Monday-Thursday pullback was followed by a Friday lift which erased the 4-day slide. We’ve seen consistent follow through since then as well, sending the SPY into Monday having posted gains in 10 of the previous 11 sessions.
A run like that is never something to discount, and if blindly I heard a stat like that, I’d be highly cautious. But in this case, it hasn’t left the SPY extended. It’s up 4% during that time, but the way it has happened has been healthy. The early portion of the run was rapid, then we settled into a rest phase. That pause lasted 5 days, yet SPY only gained $0.46 during that stretch. There was even a decline of a whopping $0.07 (Aug. 13), which isn’t the kind of a reaction the bears can be proud of.
To see this major ETF posting so many advances of late would ordinarily be a bit scary. Technically though, it’s been a sharp rally, a healthy rest, and then some continuation. Why would that be something to fade?
We’re facing 52-week highs in the SPY and S&P 500, but they both still have room to run if the bulls feel so inclined. We may turn lower and this run proves to have been a great selling opportunity. However, the bulls have created higher lows on every single pullback since the June low, and that deserves respect. I’m not about to bet against them.
Here’s a closer look at the chart of SPY for you:
Trade Like a Bandit!
Jeff White
Producer of The Bandit Broadcast
Are you following me on Twitter yet?
Denver Traders…
June 1, 2012 at 9:05 am
If you’re a Denver trader or are located in the surrounding area, make plans Friday June 8th or Saturday June 9th to see me present live in conjunction with Worden!
![]() On both Friday & Saturday (June. 8 & 9) at the Worden TC2000 workshop, I’ll be teaching live. It’s at the Denver Marriott West (1717 Denver West Boulevard, Golden, CO 80401). The workshop starts at 10am and ends at 4pm, and I’d love to see you there either day.
On both Friday & Saturday (June. 8 & 9) at the Worden TC2000 workshop, I’ll be teaching live. It’s at the Denver Marriott West (1717 Denver West Boulevard, Golden, CO 80401). The workshop starts at 10am and ends at 4pm, and I’d love to see you there either day.
Specifically, I’ll show you what’s been working best in the market lately, what looks best going forward (so you’ll leave with some actionable ideas), and we’ll build a watch list together of your stocks and read the charts together.
I have a lot of good stuff planned, plus you’ll see the new version 12 of TC2000. I’m excited about being there and giving you some insights for better trading. Make plans to be there by pre-registering or just show up (it’s free) – but get there early for a good seat!
Trade Like a Bandit!
Jeff White
Producer of The Bandit Broadcast
Get our free newsletter to keep up!
Follow @TheStockBandit
Key Index Levels for the Week Ahead 4-29-2012
April 29, 2012 at 3:42 pm
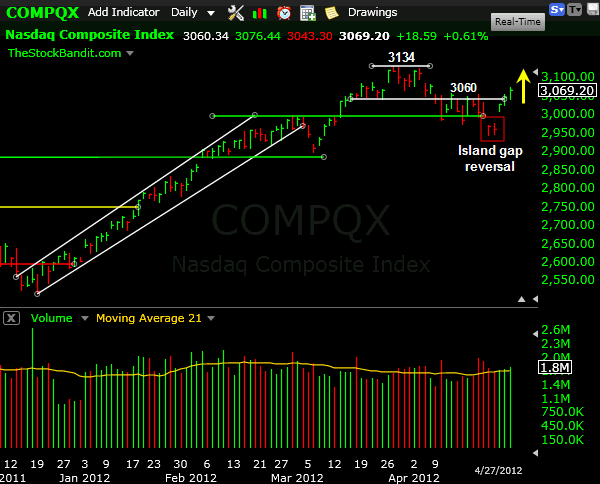
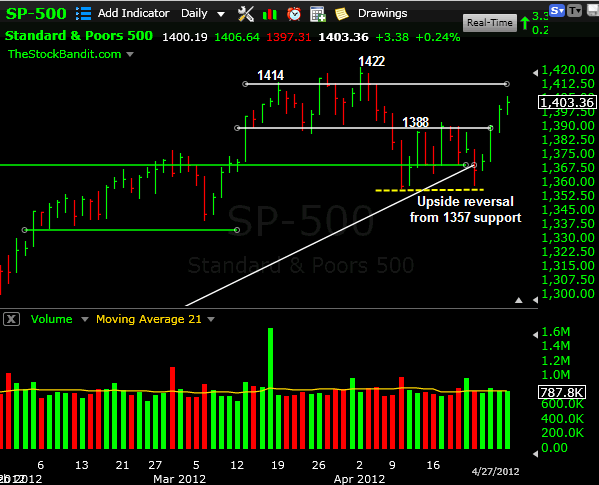
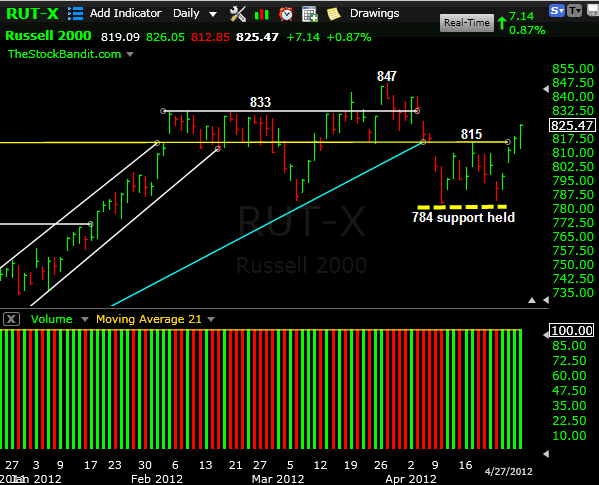
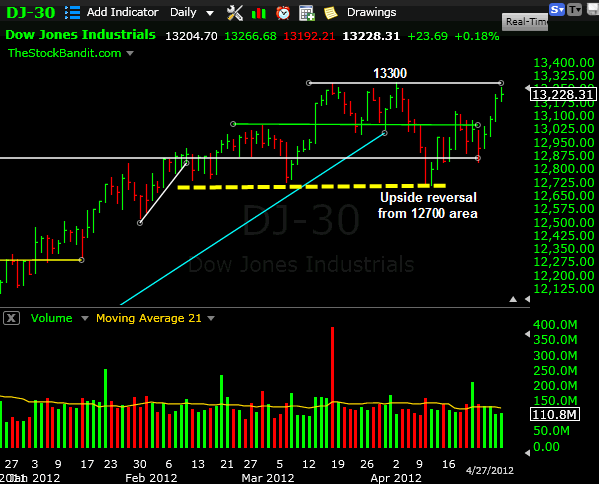
Last week the indexes headed higher after an initial breakdown, trapping many bears in the process. That move included an island gap reversal for the NAZ, something we don’t see very often.
The indexes have rallied back up through some important short-term levels, but still face some overhead in the days ahead before the bulls can expect smooth sailing again.
In preparation for the trading week ahead, let’s examine some important levels to keep an eye on for the indexes. That will have the greatest influence on how individual stocks are going to move, so it’s part of our weekend process. Put these levels on your charts or tape them to your screen, as they may be respected in the days ahead.
Overall, trading ranges still exist for the intermediate-term timeframe. For that reason, selectivity remains the key for new plays, which I’ve been noting within the member area.
Trade Like a Bandit!
Jeff White
Producer of The Bandit Broadcast
Get our free newsletter to keep up!
Follow @TheStockBandit
Wait for the Trend Line Break!
April 11, 2012 at 6:36 am
As a pattern-based trader, I use a lot of trend lines on my charts. When you look at my charts, the only indicator you’ll see is the 21-period MA of volume, which is the running 1-month volume average. Beyond that, it’s just price, volume, and trend lines around the patterns I see in price.
I keep it simple.
Confirmation of those patterns is what I require before taking entries on 99% of my trades, which means price crossing through a trend line. The way I view it, until that line in the sand is crossed, nothing has changed. The rest phase or pullback must not be done until then. I may detect price perking up or volume percolating, but until the trend line breaks, the setup cannot be fully embraced as a positive change of character.
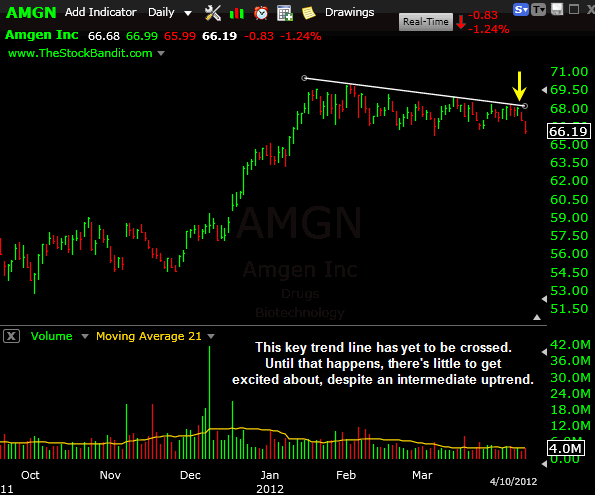
Right now there’s an excellent example in the chart of AMGN of why waiting for that trend line break can mean preserving both capital and clarity. The stock is bullish, no doubt about it, as the intermediate uptrend remains intact since it began last August. Since then, we have a series of higher highs and higher lows.
In recent weeks, the stock has been pulling back quietly with some minor profit-taking leaving price drifting lower since the early-February peak. The prior breakout was around $65 (January) so it could be the stock is in for a test of that zone, who is to say otherwise? And until a break occurs to suggest the stock is back on the move, who cares?
Currently, the stock is floundering around beneath a very valid trend line, but no less a trend line which has yet to be crossed.
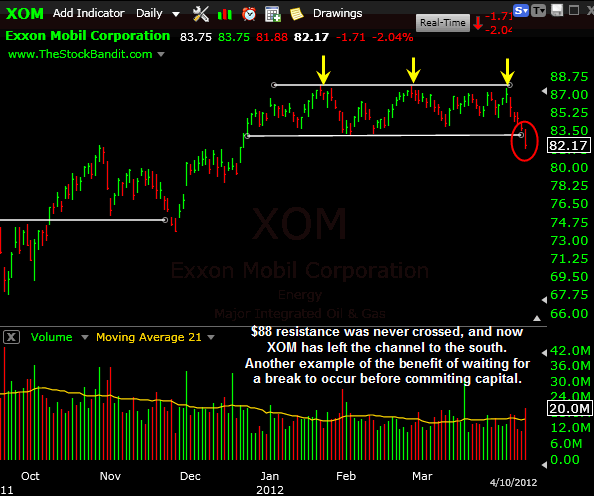
XOM is another example here as just recently the widely-anticipated push through the $88 level as recently as last week never happened. The stock has since fallen out of its channel to the downside. Waiting was the best option.
F is one more on the list with $13.05 resistance never being crossed, despite approaching it multiple times of late. Those who bought early in hopes of getting in “cheaper” ahead of the breakout actually paid up. The stock has exited its trading range to the downside, leaving premature buyers in what I’d call the “hurtin for certain” department.
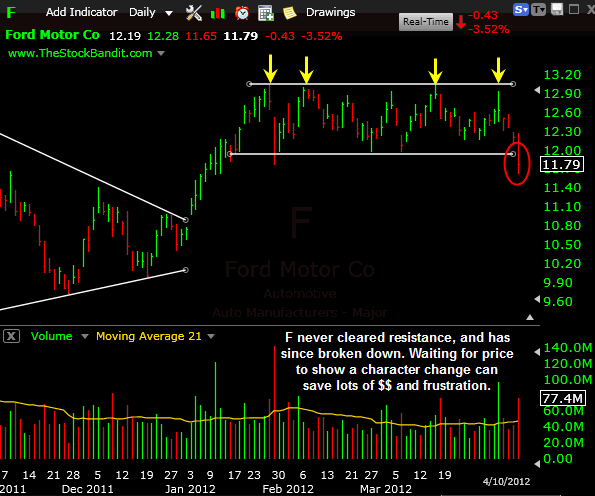
Traders by and large love to predict what’s coming, and often will take anticipatory trades as such. Doing so can be an expensive way to get caught in a stagnant name.
Carefully consider whether a stock is truly getting on the move before committing capital to entries. Could be that waiting a little longer provides you with not only better prices, but better defined exits as well.
Trade Like a Bandit!
Jeff White
Producer of The Bandit Broadcast
Get our free newsletter to keep up!
Follow @TheStockBandit
Atlanta Traders…
March 5, 2012 at 12:18 pm
If you’re an Atlanta trader or are located in the surrounding area, make plans this Friday or Saturday to see me present live in conjunction with Worden!
![]() On both Friday & Saturday (Mar. 9 & 10) at the Worden TC2000 workshop, I’ll be teaching live. It’s at the Marriott Perimeter Center (246 Perimeter Center Parkway NE, Atlanta, GA 30346). The workshop starts at 10am and ends at 4pm, and I’d love to see you there either day.
On both Friday & Saturday (Mar. 9 & 10) at the Worden TC2000 workshop, I’ll be teaching live. It’s at the Marriott Perimeter Center (246 Perimeter Center Parkway NE, Atlanta, GA 30346). The workshop starts at 10am and ends at 4pm, and I’d love to see you there either day.
Specifically, I’ll be discussing Finding the Best Charts Now (Friday 2:45 – 4:00 and Saturday 11:15 – 12:30). I’ll show you what’s been working best in the market lately, what looks best going forward (so you’ll leave with some actionable ideas), and we’ll build a watch list together of your stocks and read the charts together.
I have a lot of good stuff planned, plus you’ll see the new version 12 of TC2000. I’m excited about being there and giving you some insights for better trading. Make plans to be there by pre-registering or just show up (it’s free) – but get there early for a good seat!
Trade Like a Bandit!
Jeff White
Producer of The Bandit Broadcast
Get our free newsletter to keep up!
Follow @TheStockBandit
How Long are Levels Valid?
February 29, 2012 at 9:55 am
A Bandit subscriber recently asked me about levels and how long they should be watched. This was a great question, so I wanted to be sure to share this exchange with you.
 Question:
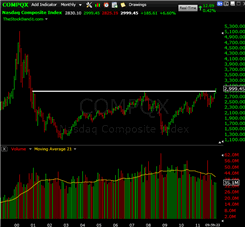
Jeff, I’m new to trading (since Christmas). I’m wondering how important long term resistance levels are. I suppose it depends really on the market conditions. A skittish market probably respects them more. This market seems to be plowing on through them regardless. The NASDAQ now, is free and clear of them with its breaking through the eleven year high, unless it goes down again.
The reason I am asking is that I’m sticking to a 4 1/2 month chart and ignoring any information older than that. It simplifies things and I wonder how far back people really remember. I also am thinking the older the resistance/support level, the less significant it is. Do you think I will be ignoring less recent history at my peril? I also find that the more information I bombard myself with the less clarity I have.
Thanks
Answer:
Great question and this really deserves its own blog post so I’m glad you asked. To answer you though, here’s my take on it.
I’ll begin by saying as long as a level is being respected, it’s worth taking note of. That pertains to an individual stock which keeps knocking on the door over the past few weeks, or to an index chart like the NAZ which has just recently pushed through multi-year resistance.
So, they’re worth taking note of. As far as how important they are, let’s consider the psychology at work here, which is what it really comes down to.
Technical levels are representations of buyers and sellers, which often times base their decisions on emotions. The older the level, the less emotional significance I’d attach to it. More recent levels are fresher in terms of emotion, and therefore tend to get respected to a greater degree.
I’d say anything inside 18 months or so is game, whereas I place lower significance on multi-year levels. They may be noticed by technicians, but anyone who has held for 11yrs in the case of the NAZ isn’t likely to bail out now that they’ve finally gotten their money back – I think they’re the “invested” crowd who never truly intends to sell.
What do you guys think? What would you tell this new trader?
Trade Like a Bandit!
Jeff White
Producer of The Bandit Broadcast
Get our free newsletter to keep up!
Follow @TheStockBandit


