 All Entries in the "Chart Reviews" Category
People of Wal-Mart: Still Spendin’
December 15, 2011 at 9:17 pm
While the People of Wal-Mart website is always an entertaining bookmark, the stock itself is no joke. Sporting nearly a 20% return since its August low, this slow mover has outpaced the S&P’s return by about 2 1/2 times.
Checking out the recent price action, the stock is a bit range-bound, but a closer examination reveals an often misunderstood pattern: the cup & handle pattern. The look of the pattern is easily identifiable to even novice chart readers, but they usually fail to take it in context. Here, it’s right where it should be found – within an uptrend.
Here’s a closer look at the chart:
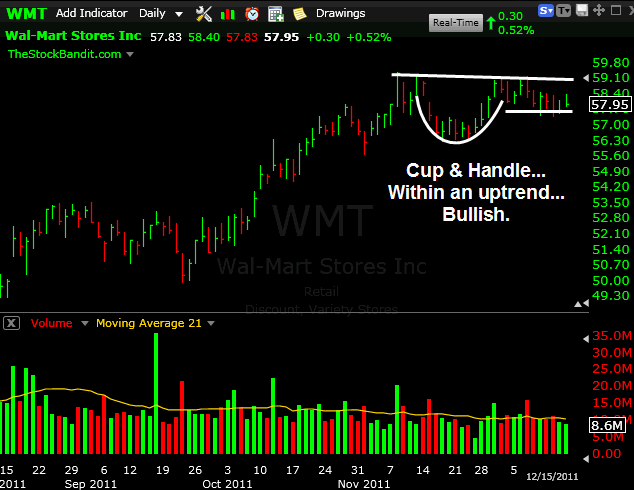
A confirmation of this pattern with an upside exit would put this one in the mid-60’s in short order, so it’s worth keeping on the radar even though it’s far from a momentum name. If anything, this is simply an example worth pointing out. The handle may need a bit more work and it needs to threaten the upper trend line to indicate a move is imminent, but it belongs on the radar no less.
Trade Like a Bandit!
Jeff White
Producer of The Bandit Broadcast
Follow TheStockBandit on Twitter or get our free newsletter to keep up!
Trading Timeframe Influences Position Size
December 13, 2011 at 8:58 pm
 Equally important to locating entries and exits is the matter of sizing your positions. Too much and you can’t stick with the trade plan, aborting in favor of diminishing emotions (whether greed or fear). Too little and you don’t maximize the use of your capital.
While some traders prefer a standard lot size, in this video I’ll discuss the notion that your timeframe for the trade should influence your position size.
Yes, the chart itself will help determine your exits, but that’s also a function of how long you’ll expect to be in the trade.
Check out the video for a quick 5-minute explanation and you’ll see exactly what I mean.
(Direct video link is here for those interested in sharing).
Be sure to view in HD (720P) and full-screen mode for best quality in the video.
Trade Like a Bandit!
Jeff White
Producer of The Bandit Broadcast
Follow TheStockBandit on Twitter or get our free newsletter to keep up!
2 Levels to Watch for GLD
December 12, 2011 at 5:45 pm
GLD is the 2nd-highest capitalized ETF around, only behind SPY. It’s nearly triple the capitalization of QQQ, just to give you some perspective. And with such a fixation on the economy (both domestic & global), it’s no shock that the sometimes safe haven of gold has been in the limelight.
Some suggest GLD has topped, and in the near term, they have technical reasons which back that up (lower highs). But a closer look at the chart reveals a pair of important levels to keep on watch, so that’s what’s covered in this video.
(Direct video link is here for those interested in sharing).
Be sure to view in HD (720P) and full-screen mode for best quality in the video.
Trade Like a Bandit!
Jeff White
Producer of The Bandit Broadcast
Follow TheStockBandit on Twitter or get our free newsletter to keep up!
DFW & North Texas Traders…
December 2, 2011 at 9:51 am
![]() If you’re a DFW trader or are located around the North Texas area, make plans next Friday to see me present live in conjunction with Worden in Dallas!
If you’re a DFW trader or are located around the North Texas area, make plans next Friday to see me present live in conjunction with Worden in Dallas!
On both Friday & Saturday (Dec. 9 & 10) at the Worden TC2000 workshop, I’ll be presenting in the afternoon. It’s at the Doubletree Hotel Dallas near the Galleria (4099 Valley View Lane
Dallas, TX 75244). The workshop starts at 10am and ends at 4pm, and I’d love to see you there either day.
Specifically, I’ll be discussing Preparing Like a Top Trader in Today’s Market. I have a lot of good stuff planned, plus you’ll see the new version 12 of TC2000.
Make plans to be there by pre-registering or just show up (it’s free)!
Trade Like a Bandit!
Jeff White
Producer of The Bandit Broadcast
Follow TheStockBandit on Twitter or get our free newsletter to keep up!
Viewing a Loss as a Courtesy
November 29, 2011 at 8:56 am
My ‘Don’t Be a Monkey‘ post prompted some discussion on how to view losses, so I just want to explore that idea a little further. Specifically, Eric commented ‘learn to love loss, and you are on your way.’
Love might not be my chosen word for it, but yeah, that’s the idea. Put it this way…
Last year, we were house hunting with our realtor. When we’d pull up in front of a house that just wasn’t at all our style, we’d offer a preventive “next” to save us all the time of going through a house we just didn’t envision actually buying.
You can’t judge a book by its cover, but some houses you can! Plus, this was a close friend, so he didn’t mind. In fact, he appreciated it. By crossing those no-way houses off our list, it narrowed the search and saved him time.
Couldn’t you view your trades that same way? You could even look at each position as an employee. Poor performance is grounds for dismissal. Take the attitude of “thanks for letting me know you aren’t going to work so I can move on to the next candidate.”
When your trade’s showing you poor price action, don’t get upset. That just might be a gift – a signal to move on to the next idea. No point in getting your feathers ruffled or making it personal. That will only compound your frustration.
In our member area, I’ve been trading the exact same way. Booking some winners here and losses there, playing the numbers game that trading always is. No single trade carries great importance, but it’s important that losses are viewed properly. A failed breakout or a sluggish move away from a key area means the trade is suspect and may require an adjustment or early exit. I appreciate those warnings from the price action.
And even when in a position, I’m taking note of those subtle changes of character, staying aware of signals the price action may be sending which suggest the trade is struggling.
Recently I entered ADTN upon a breakout attempt at $34, but it just couldn’t stick. A few attempts to clear that level continued to show hesitation, so I tightened my initial stop by 2% on 11/16. I’m glad I did. The stock reversed to stop me out the next day, I booked a tiny 1.7% loss, and moved on to the next trade.
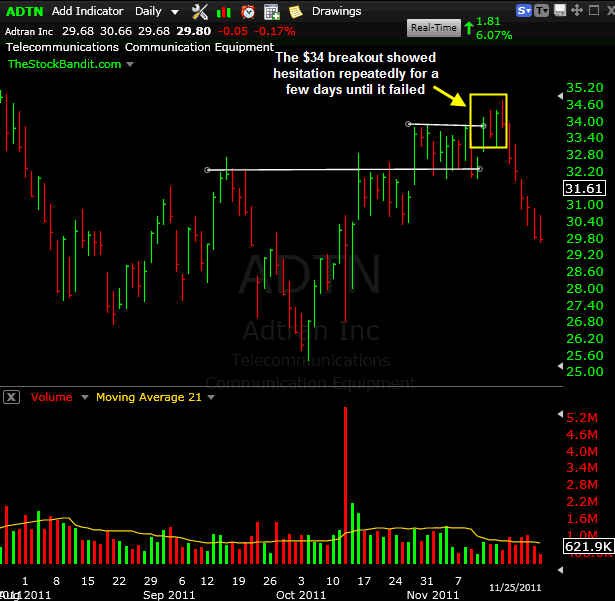
By taking cues from the price action (including failed patterns), it’ll only save you money by way of useful adjustments. Look at those as a courtesy.
Trade Like A Bandit!
Jeff White
Producer of The Bandit Broadcast
To see what I’m trading tomorrow and how I manage my trades, check out the free trial of our stock pick service.
Why I’m Careful Trading Drug Stocks
November 22, 2011 at 10:22 am
I’m really careful with trading drug stocks, there’s just so much to them. You have things to consider like FDA approvals, patient trials, lawsuits, huge news of positive or negative test results, etc. It can get to be a mess, and very few of those items are scheduled news, so they’re usually surprises.
That might sound exciting to some, but any veteran trader like me would tell you that surprises are not what a trading career is built on. Surprises spook us, and full-time traders like me want only to avoid them.
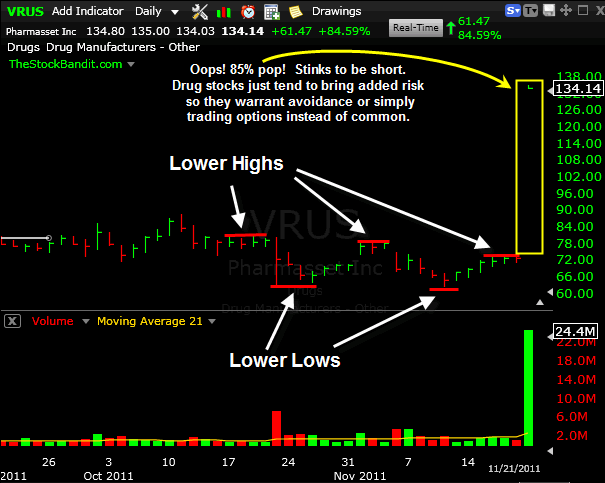
Take the buyout news in VRUS, for example, which sent the stock higher on Monday to the tune of 85%. Catching a pop like that doesn’t sound so bad, right?
Well, considering that technically the stock was set up better for a short than a long, the technical play wasn’t to be long over the weekend. The daily chart had shown both lower highs and lower lows in recent weeks. Those short would have effectively lost their entire position. Ouch!
Among other (more important) things this week, I’m thankful I had no position to begin with, but I just couldn’t help but notice the outsized gap on Monday morning.
Risk in market is required to profit, but great traders identify ways to reduce risk. Buyouts aren’t easy to see coming, but drug stocks just have too much other stuff going on anyway.
Bottom line: drug stocks are very tricky when it comes to overnight trades, so be consider the VRUS move another reason to be careful if you’re trading them (and consider options instead of common).
Here’s a closer look at the chart:
Trade Like a Bandit!
Jeff White
Producer of The Bandit Broadcast
Follow TheStockBandit on Twitter or get our free newsletter to keep up!
Detecting Subtle Changes of Character
November 15, 2011 at 12:06 pm
As traders, it’s imperative that we take note of any nuance or variation from character when reviewing charts. Doing so can give us occasional false or contradicting signals, but it can also alert us to imminent moves or potential pattern failures.
Take for example those imminent move alerts. A sudden perk in volume as a stock turns to challenge a key level can sometimes be an indication that a breach of that zone is about to take place. Someone’s accumulating shares ahead of the break, and technical traders will take note of the volume expansion ahead of a possible break, placing that stock on the radar of many.
Deteriorating Demeanor
Potential pattern failures can also come to light sooner by taking note of variations in how the stock is moving. With that in mind, let’s examine a stock which may be giving off some of these subtle suggestions like I’ve been discussing.
ARUN has a multi-month uptrend line (higher lows) which has provided support on numerous occasions, letting dip-buyers use it as support to play short-term bounces. It’s still intact, but something else is of concern.
Specifically, the stock had been establishing higher highs along the way up, with each bounce attaining new recovery highs – until recently. Over the past couple of weeks, we’ve seen bounces carry to lower levels, and one could even consider drawing a rounded top around the peaks of the past month. This suggests waning strength in the stock, so I’d avoid a support-based buy at this point. ARUN may rally again from this area, but I’m not betting on it.
A New Plan
My inclination would be to give this one a bit more time and see if another descending trend line can be drawn at some point from the 10/27 peak along the recent highs and wait for an upside break. This stock has a history of clearing such trend lines (including the 3 drawn below), so that’s likely a better approach for getting long than a support buy after the establishment of lower highs.
Here’s a closer look at the chart:
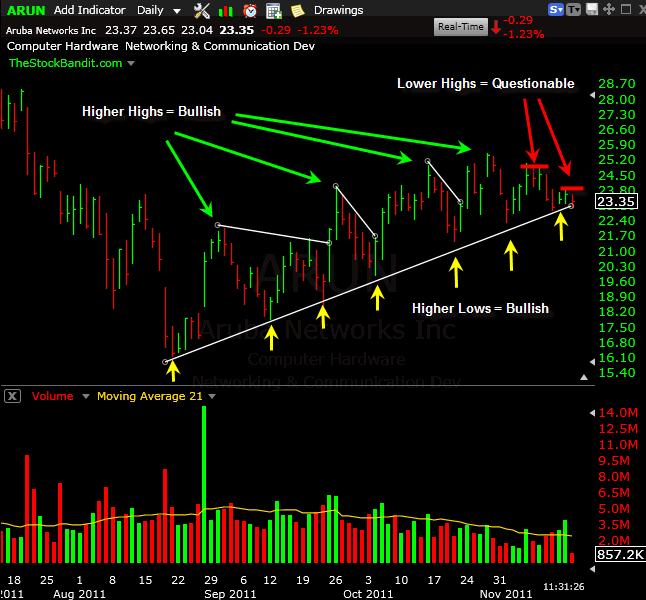
Again, detecting these subtle variations in the price action is not a guarantee for better entries and exits. What it does is alert us to potential changes of character so we can make better decisions based on probabilities – and trading is all about probabilities.
Trade Like a Bandit!
Jeff White
Producer of The Bandit Broadcast
Follow TheStockBandit on Twitter or get our free newsletter to keep up!


