 All Entries in the "Chart Reviews" Category
Two Homebuilders to Watch
July 28, 2011 at 9:22 am
Homebuilder stocks have suffered for some time now, with most of them unable to make any lasting progress on bounce attempts. Many of them have been trending lower, but there are a couple of standouts I’m keeping my eye on.
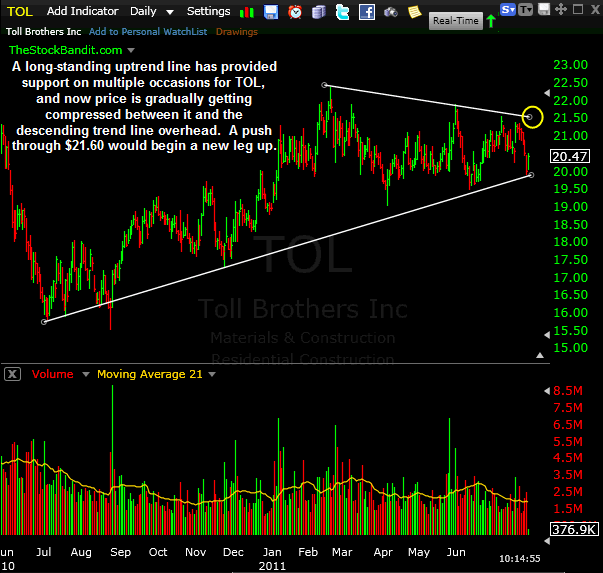
TOL is the first, as it has been creating higher lows for the past year, grinding its way higher without really showing any momentum yet. It’s been caught in a range for the past few months, but is bouncing from support here and has room to work higher in the short term. Currently, there’s a pretty big wedge setting up on the chart, so I’ll be particularly interested to see which way it gets resolved. If it’s to the upside, it may be the start of some better price action as the stock again heads higher. Earnings are due out August 22nd according to Yahoo Finance.
Here’s a closer look at the daily chart:
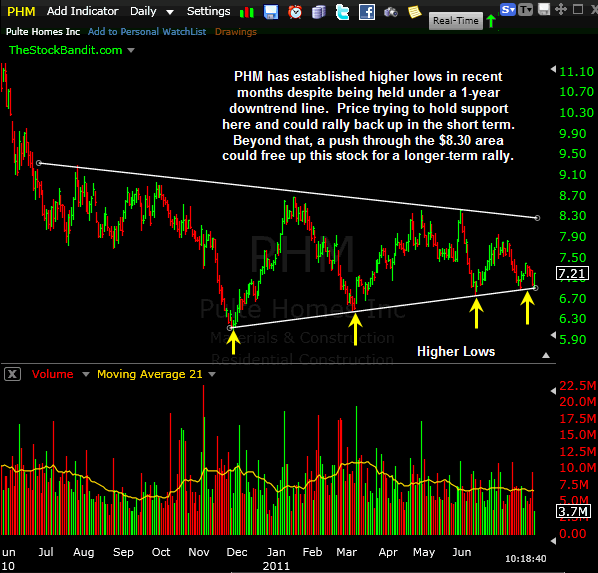
PHM is the other, as it has been creating both higher lows and lower highs for many months now. In the near term, it has room to bounce within this wedge. On a longer-term timeframe, it could gather upside momentum once it clears the downtrend line, currently at the $8.30 level. It reported earnings this morning, so the news flow should be clear for a little while.
Here’s a closer look at the daily chart:
These are the kinds of setups I take a look at for position trades lasting weeks to months. The sector itself remains under some pressure, but these are the two in the group I’d consider on the long side if support continues to hold.
Trade Like a Bandit!
Jeff White
Producer of The Bandit Broadcast
Day Trade or Swing Trade? Progression of a Play
July 26, 2011 at 11:21 am
One of the things I’m asked about quite often is how I decide my timeframe for a good setup. Will it be a day trade or a swing trade?
That’s a great question, and it took me a long time to figure that out. I go in-depth in the Advanced Trading Course at TheStockBanditUniversity.com to explain it fully, but one component in the decision is the pattern quality. That’s going to encompass the risk associated with the trade, which means entries and exits are more defined by a cleaner, mature pattern vs. one which is simply building.
So rather than just talk about it, I wanted to show you an excellent example from last week of how a stock can go from being simply a day trade candidate to a swing trade candidate when the pattern matures.
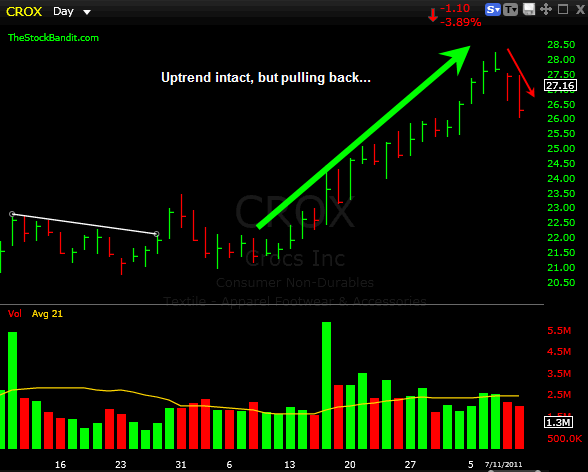
I had run across CROX pulling back from its 7/7 high on 7/11. The uptrend was still very much intact, and this looked to be a potential dip to buy once the dip was completed. Here it was at that time:
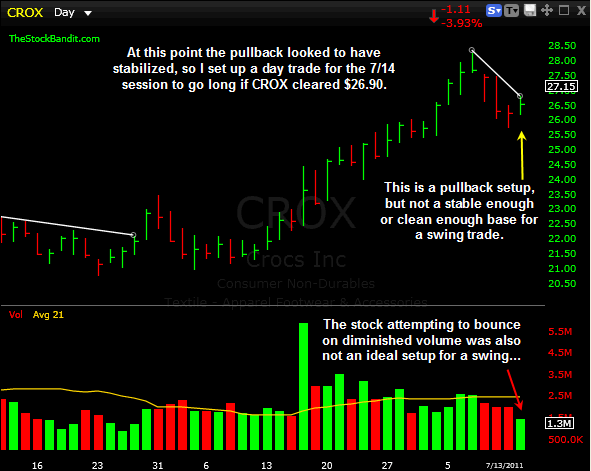
CROX needed to be watched a little longer before a play was evident, as I wanted to be able to draw a clean trend line along the highs and then go long on a push through that trend line. Sometimes you have to wait on the market. It took a couple of days, but I finally listed it for subscribers on the night of 7/13 for a day trade the following day. It wasn’t a fully mature pattern, so I was only interested in grabbing the next pop if it occurred the next day (7/14). Here was the setup, which didn’t trigger (it stopped a few cents shy of clearing the trend line, therefore no trigger):
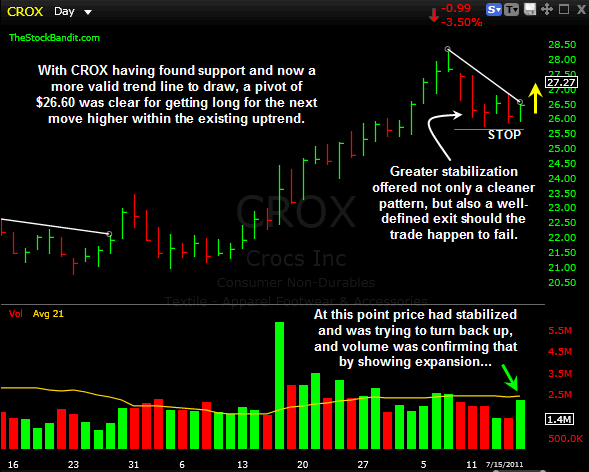
Despite not triggering an entry for a day trade, I kept CROX on the radar nonetheless. After two more daily bars had been painted on the chart, a cleaner trend line could be drawn, and the pullback had the appearance of greater stabilization. I then set up a swing trade since the pattern was more mature, the pivot was more evident, and a stop loss area was now well-defined. Here was the setup I posted for subscribers along with a $26.60 entry trigger price, a $25.70 stop loss (just beneath newfound support), and upside targets at $28 and $29:
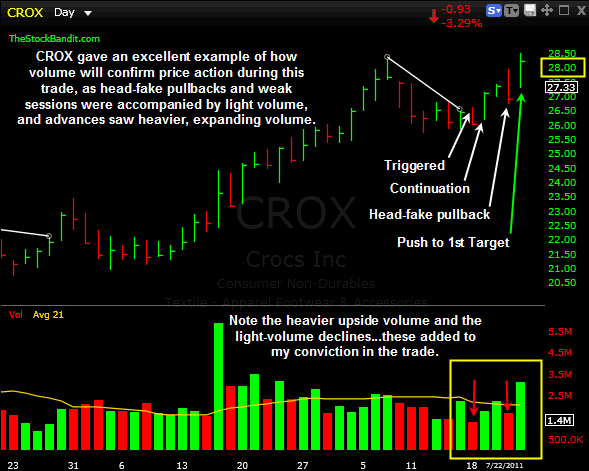
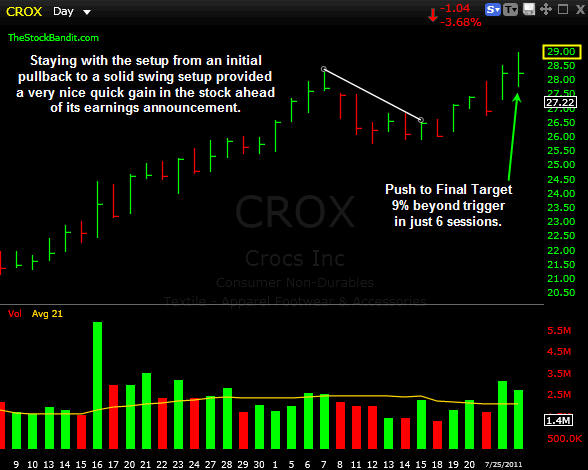
From there, CROX triggered an entry on 7/18, dipped for a day on weak volume, then got back on the move. With Target 1 at $28, the stock stopped just a few cents shy of hitting that level on 7/21, creating a bearish engulfing bar. However, I stayed with the trade since volume didn’t confirm distribution, and the following day the stock blew through the $28 first target on much heavier volume.
CROX pushed all the way to Target 2, topping out exactly at $29 on Monday. That offered a nice quick 9% gain, allowing me to book a solid profit ahead of the August 1st earnings announcement (which I always avoid). Here’s a look at the final bar of my trade:
Several takeaways…
Allow setups to determine your trade timeframe. I’ve said it many times, but the smaller the pattern, the shorter the trade should last. Bigger patterns can be trusted for more, it’s just that simple. This started out as a day trade candidate but evolved into a swing trade setup after the pattern grew and matured.
Be patient as patterns build. I stalked this stock for several days before placing a trade. Waiting for stocks to “come to you” is the best way to improve your odds of success. Risk management is crucial, pattern awareness is important, and position sizing is not something to ignore. However, it all begins with making a limited-risk entry, so timing is everything. Don’t rush the process.
Monitor the volume in relation to the price action. This stock made a few moves which, based on price alone, would have made me wonder. The trigger day saw a weak finish. Four days into the trade a bearish engulfing bar could have spooked me out. But neither were confirmed by volume. Instead, I kept seeing volume expansion along with advances in price, which gave me conviction in the trade and allowed me to stick with it.
Stick with good trades and don’t get shaken out. Along with the previous point on conviction, staying with a good trade can be tough. The price action or the overall market activity can cause premature evacuation. Stick with your trade plan and what the overall trade is doing. If it pulls back but volume’s weak, stay with your existing stop. It could just be a head fake on the way to much higher prices.
Hopefully this walk-through helps you understand better how I determine my timeframe for a trade. Beyond that, this review should also give you some insights into managing trades along the way, because learning to assess how a trade is developing is a critical skill you must possess for trading success.
If you want to know what I’m trading tomorrow, stop by the site and begin your trial to our stock pick service.
Trade Like a Bandit!
Jeff White
Producer of The Bandit Broadcast
Just What the Bulls Need
July 20, 2011 at 11:41 am
I noted yesterday that we were getting an upside resolution to the bull pennant pattern in the S&P 500, and it was no doubt a big day. The point and percentage gains across the board were impressive, yes, but were still outweighed by the technical move.
Breakouts need to see follow through. Sometimes they need it immediately, and other times it just needs to happen soon after.
For example, a minor breakout really needs to be followed by some immediate strength to build on the breakout and prevent a failure. On the other hand, a major breakout doesn’t necessarily have to see second-day strength to prove its validity. In those cases, a day or two of digestion are perfectly fine.
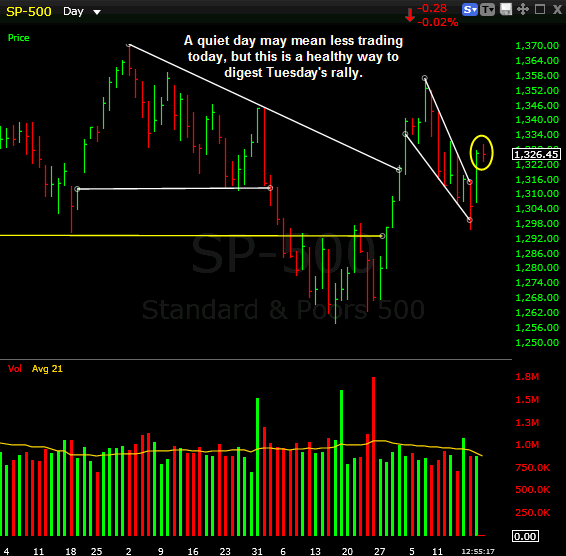
That’s how I’m interpreting today’s price action. The market made great strides yesterday to leave the pullback phase it had been stuck inside of, and today has been pretty quiet so far. Because of the size of yesterday’s breakout, I don’t think it’s imperative that we see continued strength today. A day or two of rest are a healthy way to digest that move, particularly for the case of the bulls. It allows for some churning between profit-takers and those nibbling at shares, and it lets the market catch its breath before possibly making another run.
We’ll see how this plays out, but that’s how I’m viewing it at the moment.
Here’s a closer look at the S&P 500 daily chart:
This day of rest is also highly important for the charts of individual stocks, as sharper moves tend to lead to reversals rather than pullbacks. Keep that in mind as you work your watch lists.
Trade Like a Bandit!
Jeff White
Producer of The Bandit Broadcast
Upside Resolution
July 19, 2011 at 1:13 pm
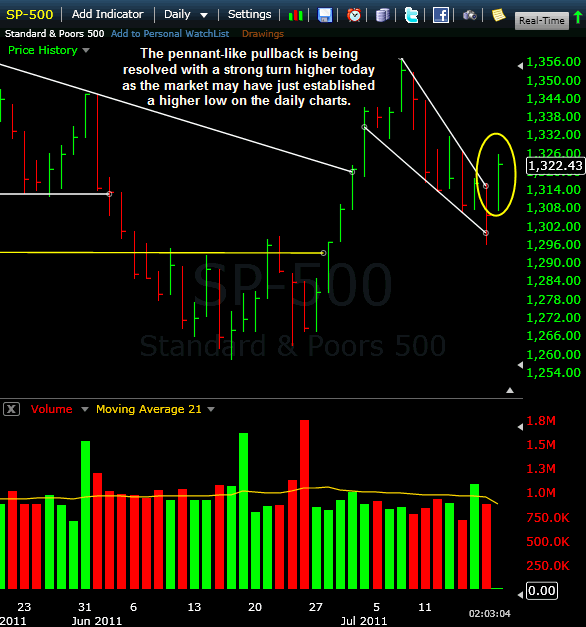
The 7-bar pullback off the July 7th high has been a pretty methodical one, despite some wide-ranging bars and overnight gaps. Nonetheless, the pace of the pullback has been well-defined by the upper descending trend line, while the lower descending trend line has marked support.
Monday’s test of the lower trend line resulted in a temporary breach, but the S&P 500 recovered enough to reclaim that level by the closing bell. Not only did that erase a chunk of losses from earlier in the day, but it gave a bit of an exhaustion appearance on the daily chart.
Today we’re seeing widespread strength with a solid thrust back up through the upper trend line. This is marking a multi-day high, at least for now making it an upside resolution to the large bull pennant pattern which had been building.
Going forward, holding this breakout on a closing basis and seeing the bulls follow through on this advance will be key to making it stick. If it does, we’ve got ourselves a higher low on the daily chart, and recent highs could quite easy come into view soon.
Here’s a closer look at the S&P 500 daily chart:
The wide trading ranges are still intact for now, but a continuation of the summer rally which started at the end of June is certainly a bullish technical event. I’m currently long and eyeing more setups.
Trade Like a Bandit!
Jeff White
Producer of The Bandit Broadcast
Taking It to the Bank(s)
July 12, 2011 at 7:49 am
Banks stink. Since February they have stunk. (Stank? Stunken? I’ll figure that out later.)
What’s interesting though, is the overall health of the S&P 500 without the participation of the banks. Generally the banks lead the market, yet they’ve been sliding for months and this market has stayed afloat rather well.
So are the banks no longer important, or is this a signal waiting to be recognized?
Either this market is going to turn and follow the banks, or the banks will at some point turn and add another layer of strength to this market. What’s your take? I’ll give you mine down below. Let’s look at a few of the majors…
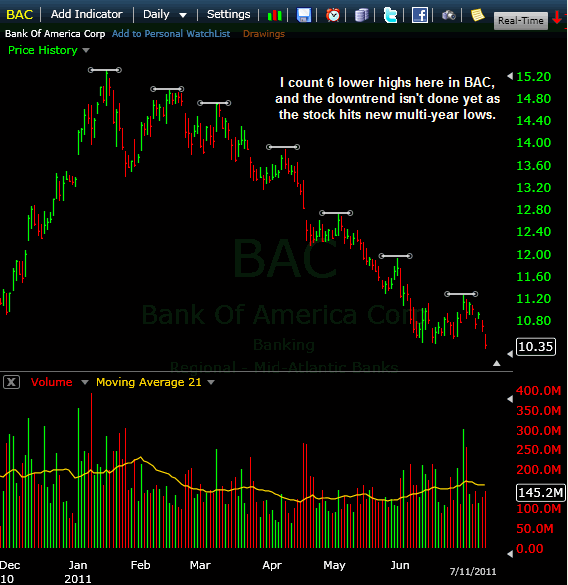
BAC – It’s difficult to locate a more methodical downtrend anywhere in the market than this.
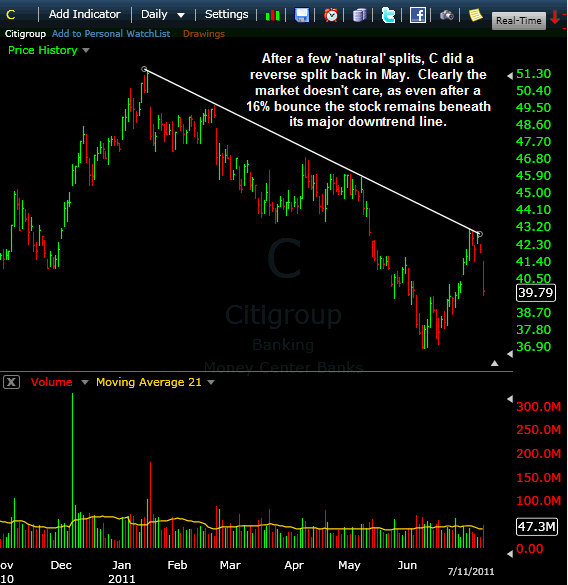
C – One-for-ten reverse split included, this one has gone nowhere but south. See that downtrend line? Yeah, so does everyone else. But why isn’t anyone talking about it?
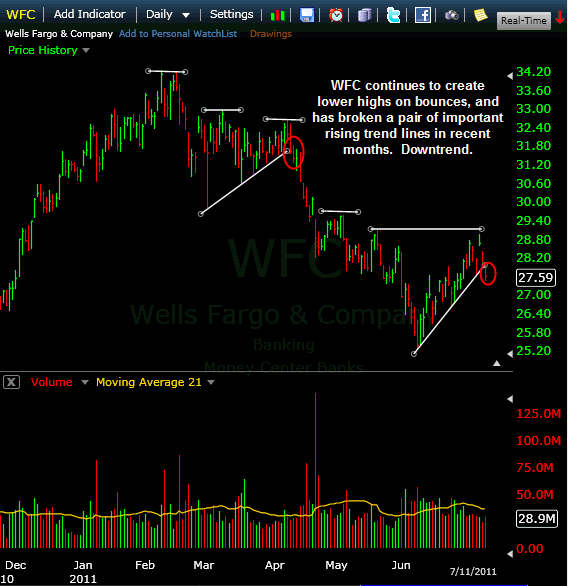
WFC – This one has had glimmers of hope and potential stabilization a few times, but in every case it has failed to do anything but produce new lows. Lower highs: check. Broken rising trend lines: check.
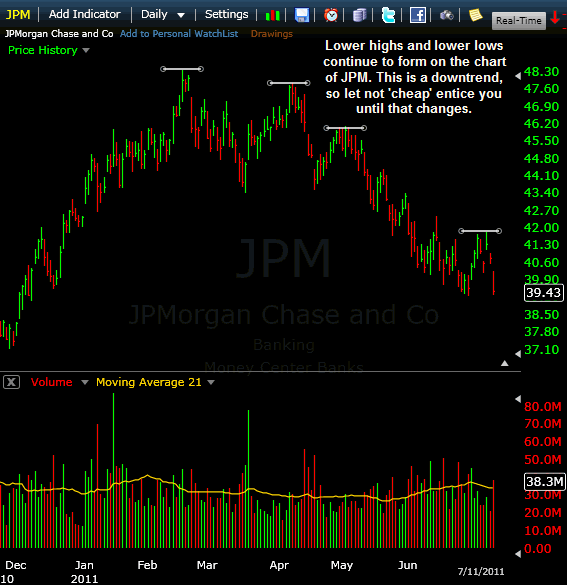
JPM – Bounces continue to get sold here as well. Why even think about getting long until that changes?
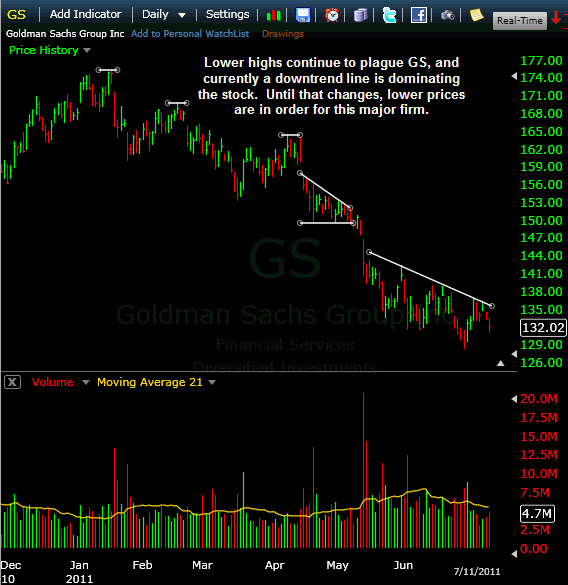
GS – The money-making machine continues to work its way toward lower levels with lower highs and a downtrend line currently driving it steadily lower. Great company, perhaps, but hideous stock.
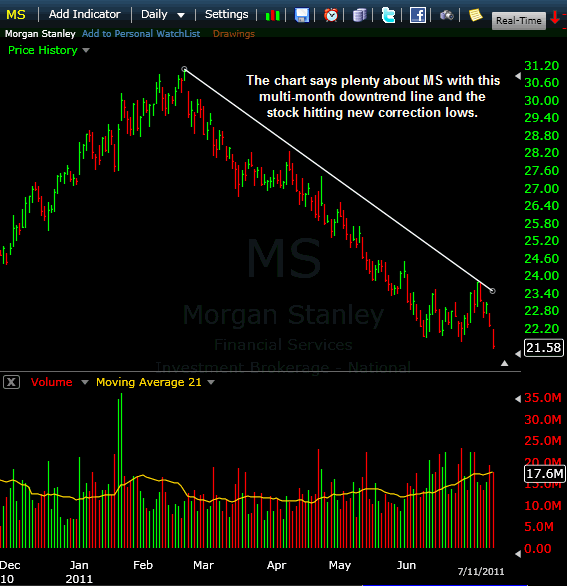
MS – Another picture-perfect downtrend which will perhaps at some point end, but not yet. New lows were made yesterday, and while it’s getting ‘cheaper’ it clearly isn’t done yet.
Other brokers like SCHW, AMTD, ETFC and the like are suffering similarly, as are major asset management firms (JNS), other banks, etc. The technical damage in the financial sector is widespread, and while there will be bounces, I don’t think the market will be out of the woods until we see participation from this group.
Trade Like a Bandit!
Jeff White
Producer of The Bandit Broadcast
Strong Coffee
July 11, 2011 at 9:39 am
Truth be told, a Slurpee is the beverage that’s actually on my mind (happy birthday 7-Eleven), but if you’re looking at the charts of anything drinkable right now, it’s all about coffee.
Granted, it doesn’t quite have the same ring to it as the 1999 Bubble or the Crash of 1929 (or ’87), but the Great Coffee Rally of 2011 is on.
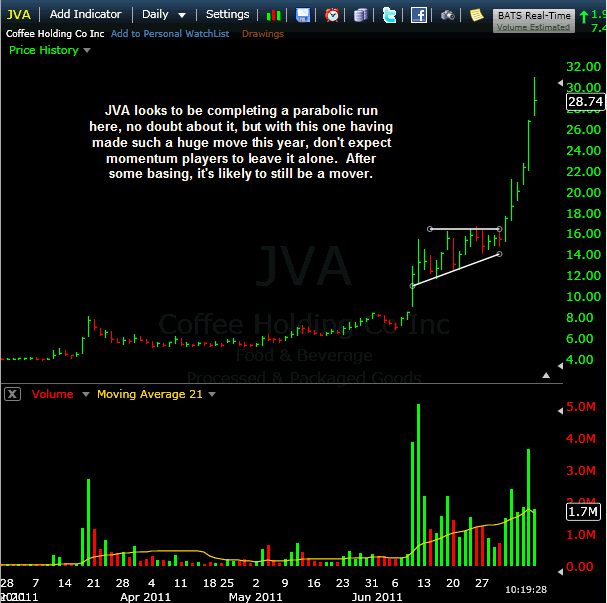
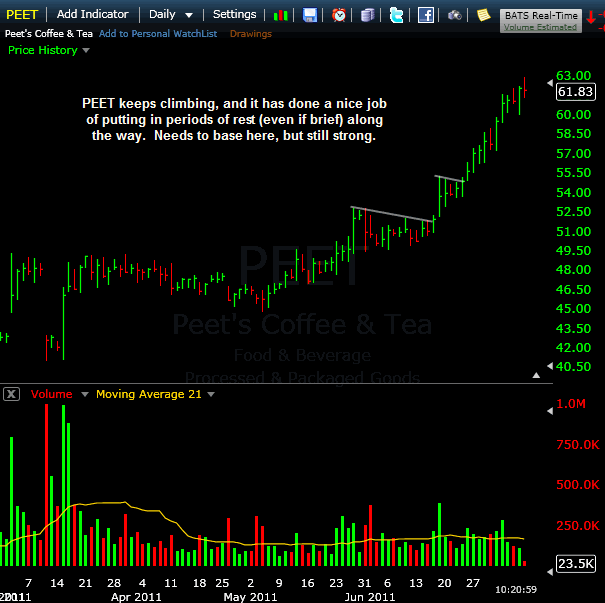
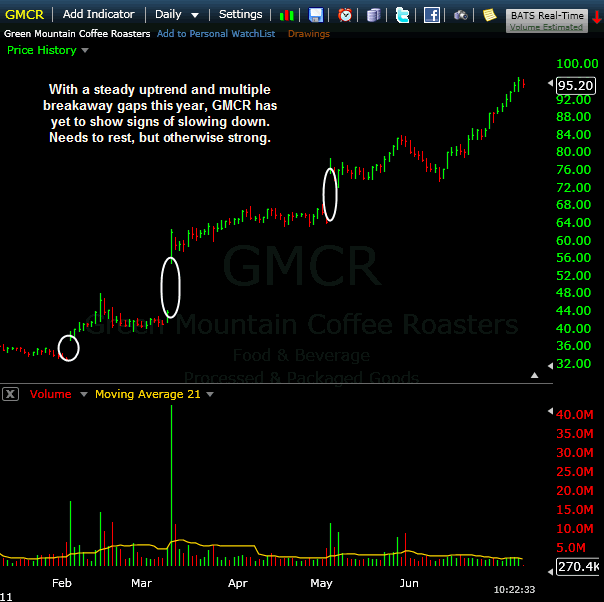
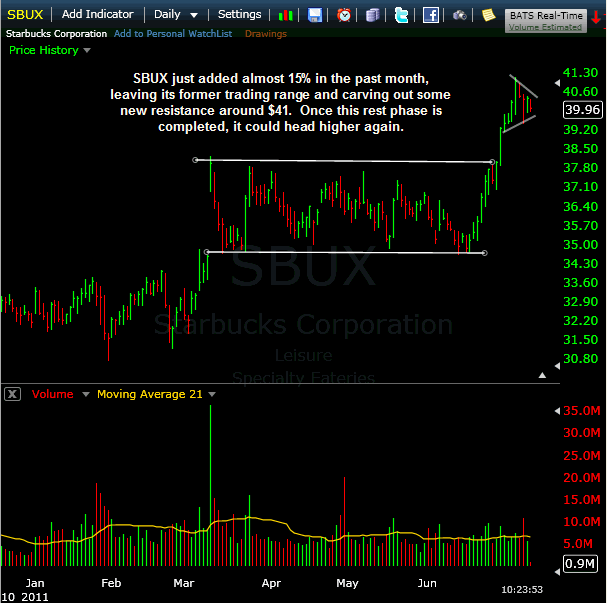
Names like CBOU, JVA, PEET, GMCR and SBUX have been ramping in recent weeks, putting them squarely on the radar of momentum players far and wide. This isn’t your typical grind (no pun intended) higher. These things are hotter than a car hood in the Texas summer.
Like quite a few other stocks, most of these could certainly stand to put in some rest here in the short term, but once that’s done, these are among the strongest (no pun intended) stocks in the market. Let’s take a closer look at each one.
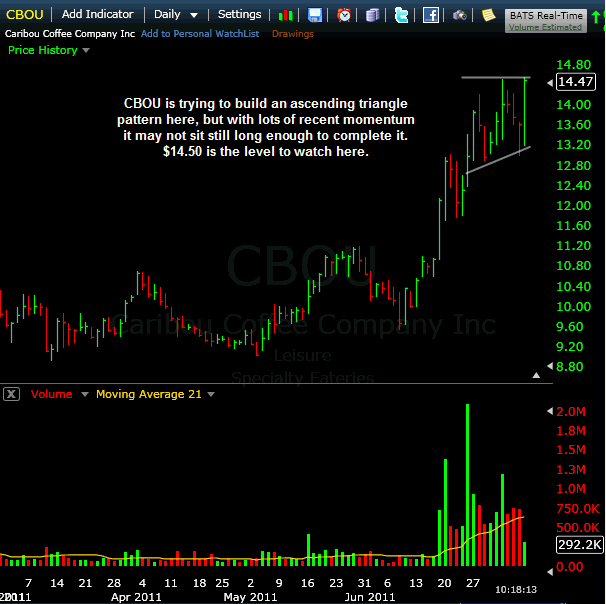
CBOU – Nice pick up in not only activity, but of course in price as well since the higher low was established in early-June. Next levels are $14.30 then $14.50 to set this one free for higher prices.
JVA – The July run alone has been more like a quintuple shot of espresso than your average cup of coffee. We’ve also seen a 323% gain since June 6th – how’s that for a wake-up? Incredible short squeeze action here and way too extended at the moment to consider an entry, but certainly deserves a spot on the watch list for one of these days when it has settled down and created a new pattern.
PEET – More of a steady grinder, this one has actually built a couple of bases along the way up. It’s not in a place where I’d be getting long, but once it puts in some rest, it’s certainly one to revisit. Lighter volume than the others.
GMCR – At $95 per share, it’s a little rich (no pun intended) for some, but the uptrend is steady and this one continues to run. This year alone, we’ve seen 3 breakaway gaps which never saw attempts to get filled, serving as reminders that this one is very strong.
SBUX – The grandfather of them all might be kinda old, but he’s still got it! SBUX left a multi-month channel with a solid push higher a few weeks ago, tacking on nearly 15% over the past month. Currently it’s trying to put in a little rest, which is healthy to see. Once that’s done, don’t be surprised if another leg higher begins.
Trade Like a Bandit!
Jeff White
Producer of The Bandit Broadcast
Stretched is an Understatement
July 8, 2011 at 9:19 am
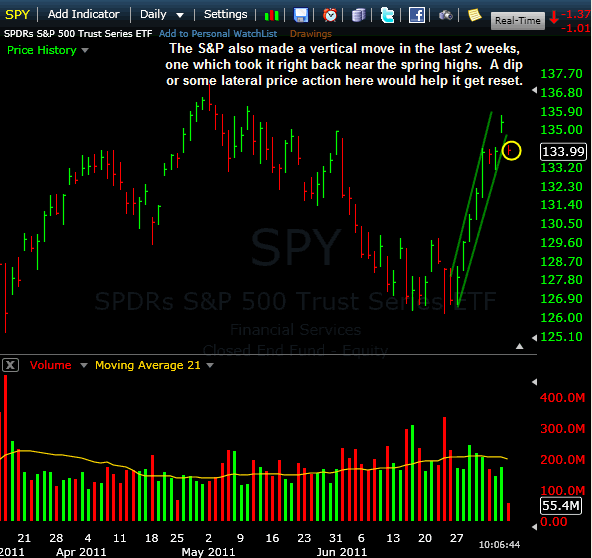
To say the run of the past two weeks has made the market stretched to the upside is clearly a major understatement. It’s been a face-ripping rally for anyone caught on the short side, while underinvested bulls gnash their teeth in nearly equal frustration.
It’s been a tricky environment in recent weeks, yes, but there is still opportunity if you search for it. The momentum run has offered some nice day trades, even if it has left many stocks overbought on the daily charts. Even a few days of rest would do wonders for those charts.
Speaking of rest, this market is poised for it, but will we get it?
The reaction to the jobs number this morning offered the perfect sell-the-news scenario as extremely overbought readings (no matter how you gauge it) left the market badly in need of some profit-taking, some lateral price action, or both. While the result of the turn lower this morning remains to be seen, we do know this: the buyers are finally standing aside to take a breather at the very least.
Thankfully, as short-term traders we don’t have to predict what’s going to come of this market in the next few days. What matters is that we continue to work the charts and trade what’s right in front of us.
With that said, a pullback here for a few days or even some short-term trading range price action would help to establish some new patterns and bases from which to take multi-day plays, one way or the other. That may not mean excitement for a few days (if we do get a rest), but it would certainly mean greater opportunity on the other side of it. I, for one, am excited about that possibility.
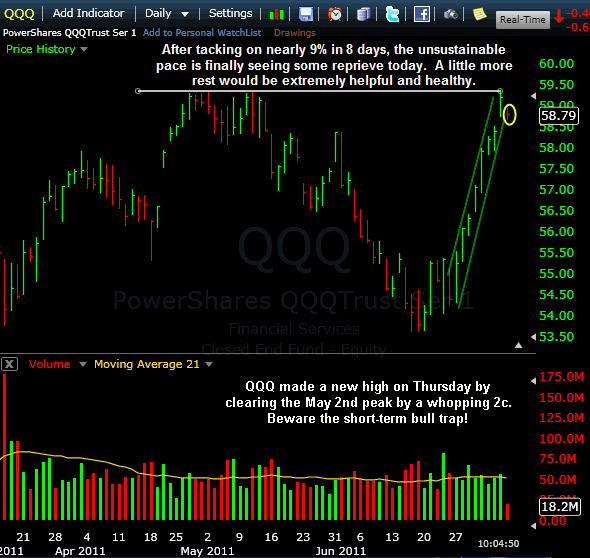
Those who have walked away for the summer have already missed considerable movement, and yet the market promises more going forward. Are you ready for it?
Trade Like a Bandit!
Jeff White
Producer of The Bandit Broadcast


