Philadelphia Traders…
September 17, 2012 at 9:59 am
If you’re a Philadelphia trader or are located in the surrounding area, make plans this Friday September 21st or Saturday September 22nd to attend the Worden Conference where I’ll be presenting live alongside Peter Worden.
![]() On both Friday & Saturday (Sept. 21 & 22) at the Worden TC2000 workshop, I’ll be teaching live. It’s at the Crowne Plaza Philadelphia West (4010 City Avenue, Philadelpha, PA, 19131). The workshop starts at 10am and ends at 4pm, and I’d love to see you there either day.
On both Friday & Saturday (Sept. 21 & 22) at the Worden TC2000 workshop, I’ll be teaching live. It’s at the Crowne Plaza Philadelphia West (4010 City Avenue, Philadelpha, PA, 19131). The workshop starts at 10am and ends at 4pm, and I’d love to see you there either day.
Specifically, in my two sessions I’ll cover Simplified Technical Analysis and Trading YOUR Way Better. I’ll also share with you what’s been working best in the market lately, what looks best going forward (so you’ll leave with some actionable ideas), and we’ll build a watch list together of your stocks and read the charts together to discover some new candidates.
I have a lot of good stuff planned, plus you’ll see the new version 12 of TC2000. I’m excited about being there and giving you some insights for better trading. Make plans to be there by pre-registering or just show up (it’s free) – but get there early for a good seat because it’ll be a full house!
Trade Like a Bandit!
Jeff White
Subscribe to our Stock Pick Service to get our trades.
Misdiagnosed Patterns Can Still Pay (HAR Trade Review)
September 16, 2012 at 3:47 pm
I don’t even know how many charts I’ve read over the years, but there are a couple of commas involved. I’ve been able to identify quite a few patterns and benefit from them, and of course I’ve been wrong a lot too.
What’s funny is that in this game, as long as you’re managing your risk well, you can sometimes be dead wrong on the pattern and still make money. Let me give you an example.
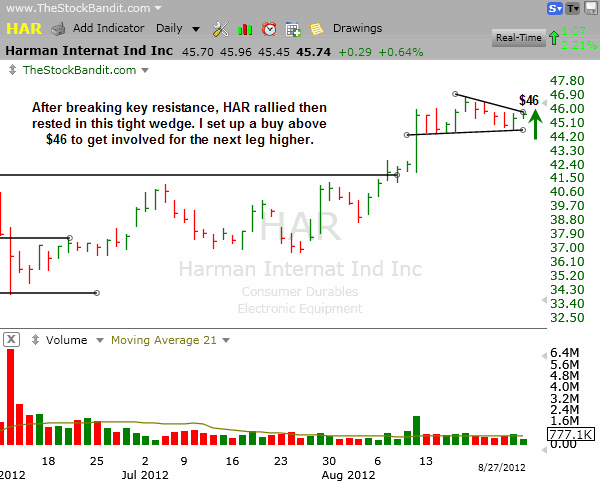
A few weeks ago, I noticed HAR as a stock which had cleared an important area ($42 in early August) and then had settled into a rest phase. I drew my trend lines and recognized a wedge, which was also a pennant after the advance in price. I set up a buy for $46 to get long on a return of strength.
Here’s a look at the chart of HAR when I set up the trade:
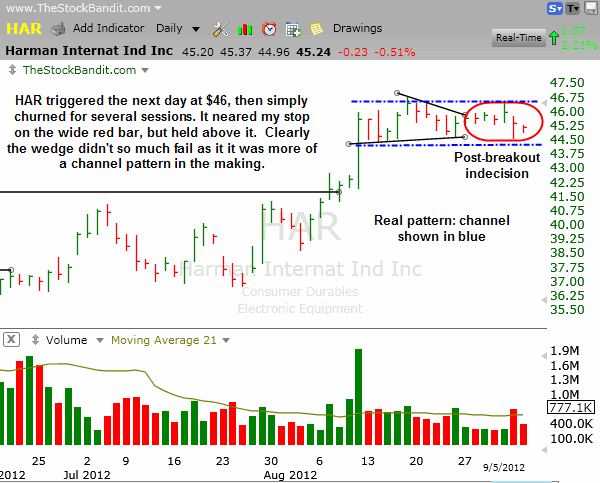
That buy triggered the next day, but the stock couldn’t get going. It actually churned for the next 6 sessions, including a test on day 5 of my stop, holding just a short distance above it to keep me in the trade. That dip was a test of support, but I was leery because I considered this to be a failure of the pattern and I expected to be taken out of the trade for a small loss.
Here’s the HAR chart at that point in the trade, and I began to realize the pattern was now a large channel and still intact:
This gave me a bit more confidence in the trade when the next day price lifted to create a little breathing room to my stop. It showed a bit more follow through, then held for a few days before hitting Target 1 on Thursday for a 5.2% profit.
Here’s a look at HAR after the return of strength:
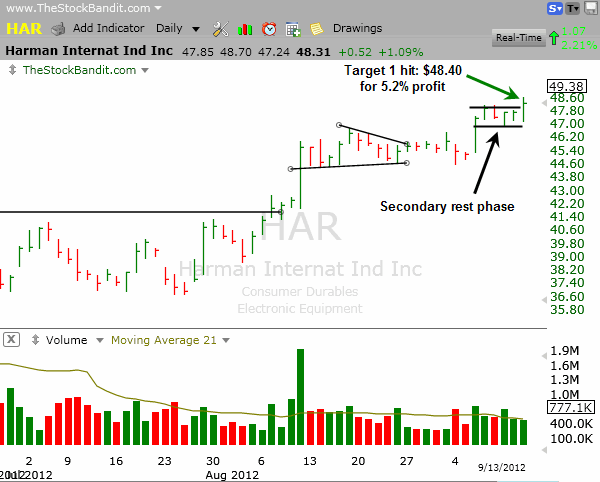
This gave me an opportunity to lock in some gains and tighten my stop for remaining shares, which I did. Then on Friday, the stock rallied again, but hesitated $0.14 shy of Target 2, which was set at $49.60. Rather than hope for an extra few cents while risking more than $2 (my stop had been moved to $47), I booked the 7.4% winner and notified Bandits of my adjusted exit.
Here’s a look at HAR as it currently stands:
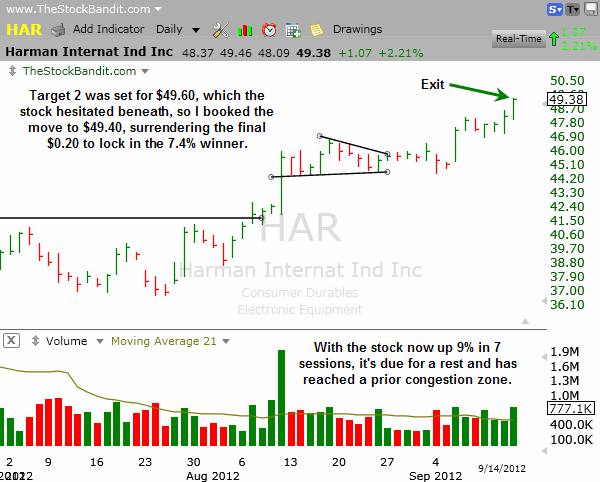
This stock may still hit Target 2, but with it being up now over 9% in the past 7 sessions, it’s due for a rest and it has approached a congestion zone from late spring.
When you’re setting up a trade, you evaluate the price action. But that evaluation doesn’t stop once you’re in. You have to keep asking questions of whether the risk/reward is worth staying in the position. This one had come to a point where stretching for a tiny bit more wasn’t worth the risk, so I took the solid profit with a smile. After all, my initial diagnosis of the setup was wrong, but I was still able to book a nice gain.
Trade Like a Bandit!
Jeff White
Subscribe to our Stock Pick Service to get our trades.
A Few Lessons From AMGN (Trade Review)
September 14, 2012 at 2:38 pm
If you’re looking for excitement, this isn’t a post for you.
This is a recap of a trade which actually yielded nothing – but there were some good lessons tied to it. Plus, I certainly wouldn’t be bragging about a breakeven trade.
The Setup
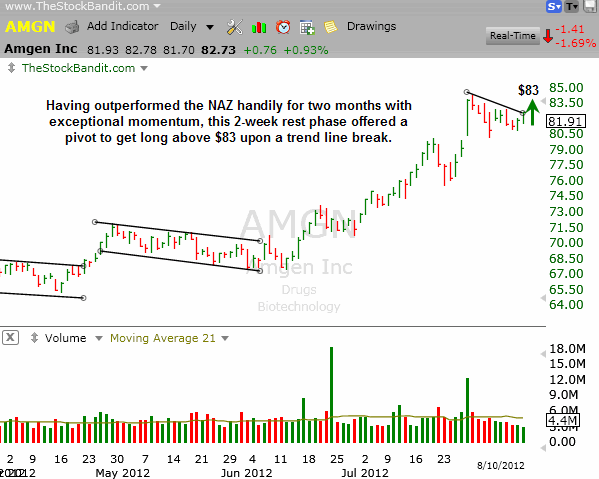
Let’s go back to August 12th, the day I originally listed AMGN for a swing trade buy. The stock had outperformed the NAZ since June 11th with a 22% gain (vs. the NAZ up 7.5%). It clearly had momentum and had been able to put in some well-deserved rest for two weeks. I noticed the descending trend line from the high, and set up a buy upon a break of that trend line at $83.00 and shared it with subscribers.
Here’s a look at the chart of AMGN when I set up the trade:
That buy triggered on Aug. 14th, and over the next few weeks the stock grinded higher but never really gathered momentum. Three times it posted a new 52-week high, only to immediately hesitate afterward.
Adjustments
Having sat in AMGN for a few weeks with limited progress, I tightened my stop loss from $80 (initial stop) to $82 on Sept. 3 in order to reduce risk. The stock had just completed a multi-day pullback and it was appropriate to tighten up after strength returned. I tightened it again to $83 a week later after the stock had tagged the prior high to the penny, only to reverse lower. This looked ominous, so I tightened to my breakeven.
The AMGN chart with my stop adjustments along the way:
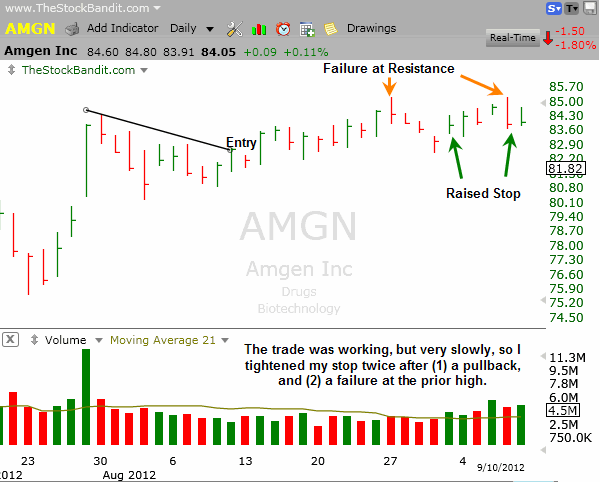
This gave the stock a little wiggle room to keep me in the trade should it turn back up, but it eliminated my effective risk in the trade. A stop out wouldn’t pay me a thing, but for a trade which never took off, neither would it cost me anything.
The Exit
I was taken out of the AMGN position at $83 on Wednesday, and since then the stock has broken down further with a solid breach of the multi-week uptrend line. Where it goes from here, I don’t know, but I sure don’t view this action as bullish so I’m out.
Here’s a look at AMGN as it currently stands:
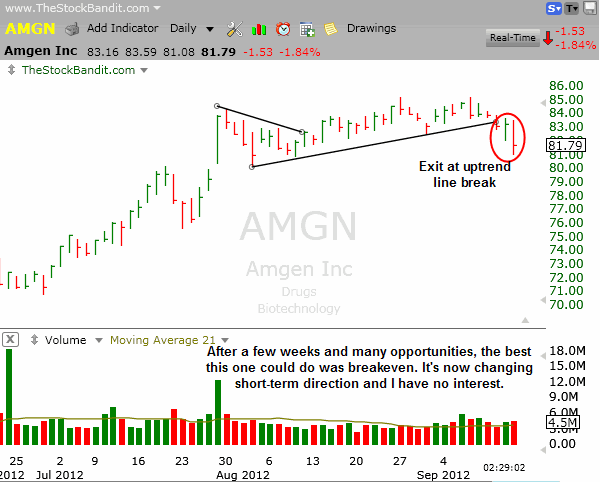
On some trades, breakeven isn’t bad. You enter a great setup, you give it room, you stay patient, and it just doesn’t ever get going. This was one of those.
Hopefully by looking back at this trade, it’ll help you manage your next position better when it acts sluggish. If you’re seeing modest rewards but after ample time you’re really not getting paid, tighten up. Odds are, if it turns lower you’ll be glad you did.
Trade Like a Bandit!
Jeff White
Subscribe to our Stock Pick Service to get our trades.
The Northern Road to Recovery
September 13, 2012 at 4:36 pm
One stock on my radar right now is Northern Oil and Gas – NOG.
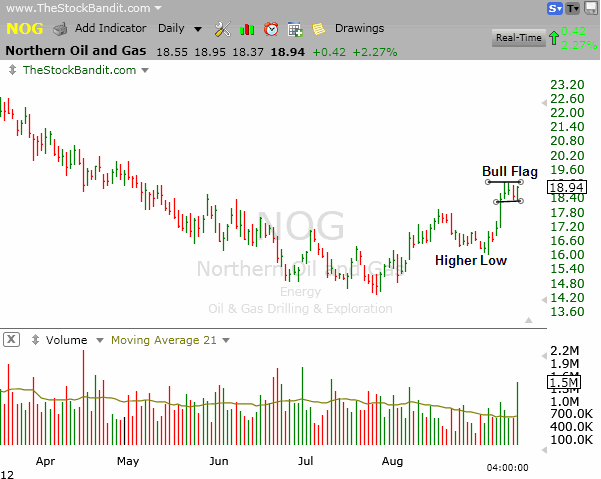
Having emerged from a 48.5% correction from the January high to the July low, the stock has seemingly turned the corner technically. A quiet lift into mid-August was met with only limited selling pressure on weak volume. That carved out a higher low, then strength returned on heavier volume with the arrival of September to mark a higher high.
Currently the stock is sitting in a tight bull flag pattern, which if resolved to the upside, could spark a continued recovery in the name. This is one to put on the radar for the days to come, as this rest phase sets the stage for higher prices once again.
Here’s a closer look at the chart of NOG for you:
Trade Like a Bandit!
Jeff White
Subscribe to our Stock Pick Service to get our trades.
When Resistance Becomes Support
September 11, 2012 at 2:25 pm
Levels on a chart become more valid with every touch. Whether it’s a trend line or a lateral level, each time price respects it, it adds credibility.
One thing I watch for frequently is for lateral support/resistance levels, and specifically when they’ve flip-flopped their roles. By that I mean a level which had been support which has become resistance, or vice-versa. That tells me that both bulls and bears alike can at least agree on that price area being important.
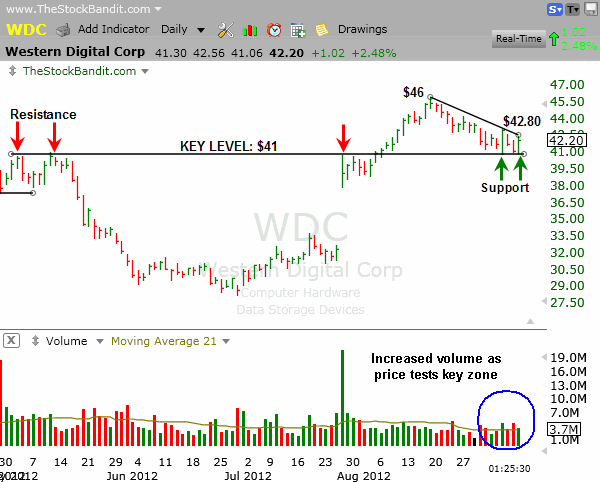
I ran across a chart today which is doing this very thing. WDC respected the $41 area back in mid May, then again in late July. The stock powered through that level in early August, but in recent days it has pulled back to find support there. We’ve also seen elevated volume in recent sessions as that level has been tested, suggesting this is indeed an area of contention.
Since the peak more than three weeks ago, a descending trend line off the high has also emerged. Currently that trend line and the $41 key level are starting to compress price. A resolution one way or another should set the stage for the next move.
Given that the intermediate term trend is up, watch the descending trend line for a possible break, currently around $42.80 (it descends daily). That may deliver some upside pressure back toward the high near $46.
The $41 level would be the natural zone to watch for a failure, but on a reward-to-risk basis that only offers about 2 to 1. That doesn’t qualify for me for a swing trading candidate, but the chart nonetheless is worth pointing out as it gives such a good example of a key level playing a role from both sides of price.
Here’s a closer look at the chart of WDC for you:
Trade Like a Bandit!
Jeff White
Subscribe to our Stock Pick Service to get our trades.
Breakout Watch: DKS
September 10, 2012 at 2:43 pm
A big element of trading the technicals effectively is having the ability to identify patterns which are under construction. Taking note of stocks which are in the development stage of their patterns helps not only in recognizing key levels to keep an eye on, but also in monitoring the price action before the stock comes to a decision point.
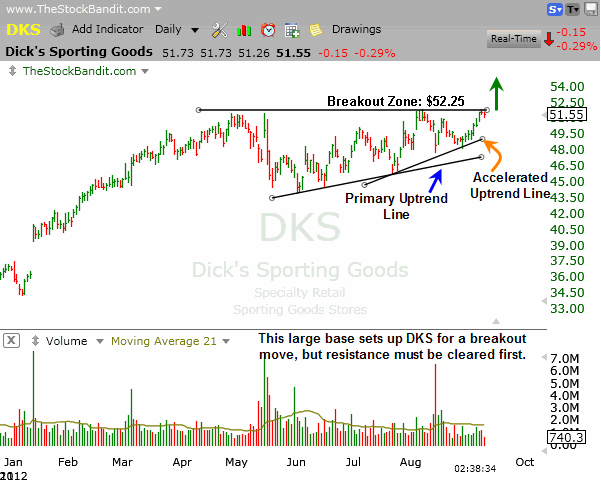
One stock on my radar right now is Dick’s Sporting Goods – DKS, which has been in a longer-term uptrend for a little more than a year. In recent months, however, the stock has put in some healthy rest which has formed a large ascending triangle pattern.
The chart shows well-defined overhead resistance, as well as a pair of uptrend lines from June and July. A push higher out of this pattern sets this stock free to begin building another leg higher.
Here’s a closer look at the chart of DKS for you:
Trade Like a Bandit!
Jeff White
Subscribe to our Stock Pick Service to get our trades.
Picking Up Points in Penney
September 7, 2012 at 9:15 am
Thursday allowed me to close out an excellent 11-day trade in JCP which paid 12.9%.
As simple as that sounds, there were several steps involved, including patience, so I wanted to walk you through the process of this trade from beginning to end in hopes of helping you with your next position.
Perking Up
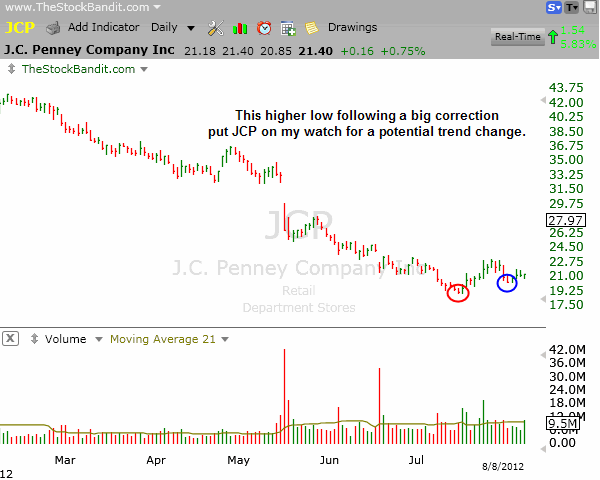
With JCP having endured a significant downtrend from February to July, the stock sat more than 55% off its highs. That alone is never reason to enter a buy, but it can indicate the shorts are overconfident and the stock has become beaten-down enough to produce a bounce.
So, after seeing a short-term higher low established in early August, it was placed on my watch list. Not for a trade, but simply to monitor in case this developed into a change of character.
Here’s how JCP first looked when I noticed it and put it on watch:
Pressuring Resistance
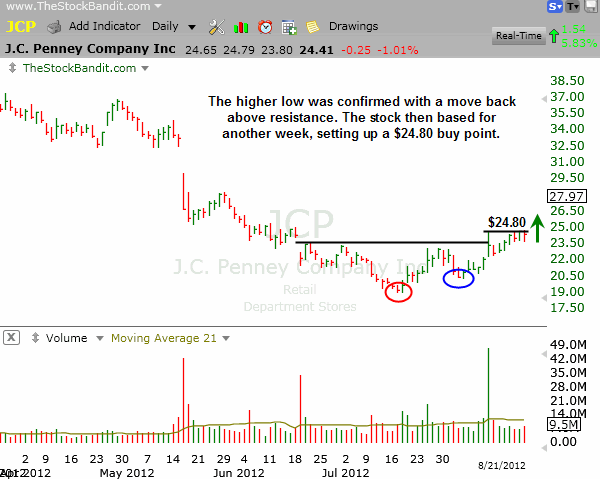
Having then rallied past resistance, JCP then entered into a narrowing base just beneath a short-term level. Dips were getting bought a bit more aggressively, creating some higher lows over the previous few sessions.
I set up a buy for $24.80, which triggered on Aug. 23. Here’s a look at the chart I shared with subscribers when I listed the trade:
Producing Gains
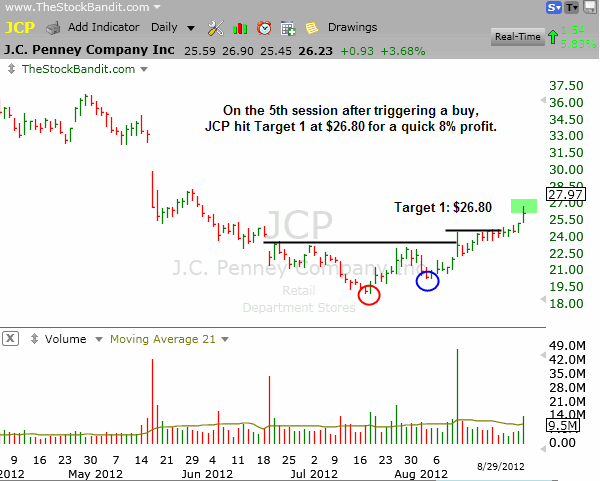
The initial trigger wasn’t met with great enthusiasm, but neither did the stock fail its breakout attempt in grand fashion. It was quiet, so I stayed with it without panicking. Just a few sessions later, Target 1 had been reached for a pretty quick 8%.
The stock pushed just 8c past that level before seeing some mild profit-taking, which ultimately allowed me to tighten my stop for remaining shares. Here’s a closer look at the chart as of Target 1:
Pausing Before Payoff
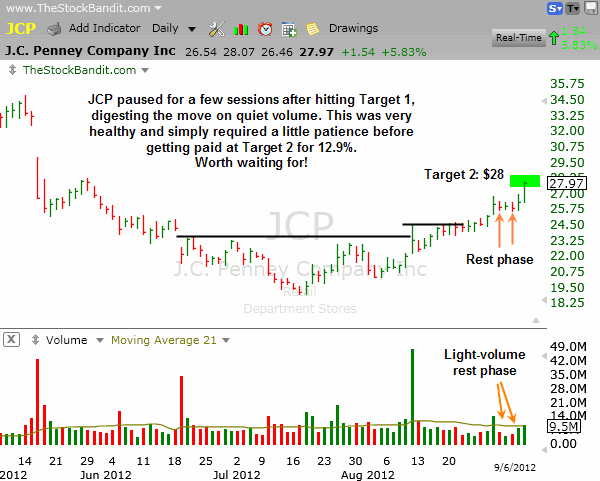
The profit-taking was mild and took place on quiet volume, which meant virtually zero pain but also required a little patience. This stage of trades always brings on the questions… “is it done?”… “should I just book this and move on before it pulls back deeper?”.
But I stayed with my tightened stop and waited for the stock to either roll back over and stop me out or push higher and prove itself. That resulted in the final push, worth 12.9%.
Here’s a look at the rest phase before the pop to Target 2:
This was an excellent swing trade which paid off quite nicely. It took some good initial analysis to detect the play, it took proper management of the position once it was on, and it took a little patience to stick with it through the mid-trade lull before the final pay day.
These are the kinds of trades we make a big portion of our money on. Every one of them is shared with subscribers of our stock pick service, along with the entire trade plan from the outset and ongoing evaluation once the position has been put on.
Try us out for yourself and see if we don’t deliver the value I’m referring to. It’s no wonder so many of our members find the monthly price so easy to pay when plays like this are provided.
Trade Like a Bandit!
Jeff White
Subscribe to our Stock Pick Service to get our trades.


